Railway Catenary System
13.1 Introduction
The catenary system is the overhead contact-line system that supplies electrical power to a train. Power is transferred from the fixed infrastructure, through the contact wire and pantograph, to the traction equipment on the railway vehicle. The system therefore has two simultaneous tasks: it must conduct enough current for train operation, and it must keep a reliable sliding mechanical contact between the pantograph and the contact wire at speed.
In Europe, electrified railways use several alternating-current (AC) and direct-current (DC) systems. The distribution shown in Figure 13.2 explains why international rolling stock often has to be compatible with more than one voltage and frequency. For the European Union, the 2024 Eurostat route lengths in Table 13.1 show that no single system dominates: the two AC systems together carry over half of the electrified length, but the DC networks remain large.
![Main railway electrification systems in Europe [114].](../../assets/chapters/ch13/original/figures_lecture_crops/fig_europe_rail_electrification_wikimedia_rendered.png)
| System | Route-km | % |
|---|---|---|
| DC 1.5 kV | 8 750 | 7.5 |
| DC 3.0 kV | 36 432 | 31.3 |
| AC 15 kV 16.7 Hz | 32 765 | 28.2 |
| AC 25 kV 50 Hz | 37 098 | 31.9 |
| Other AC/DC | 1 228 | 1.1 |
| Total | 116 275 |
Norway uses 15 kV, 16.7 Hz AC for the national railway traction power system [72, 37]. The same system is often written as \(16\tfrac{2}{3}\,\mathrm{Hz}\) in older railway literature, because it is synchronised with the 50 Hz public grid. It is shared historically with Sweden, Germany, Switzerland and Austria. The first electrified section of the Norwegian state network was Oslo V–Asker on 18 June 1922, and the first complete electrified line was the Narvik–Riksgrensen ore railway on 10 July 1923.
For the railway engineer, the important point is that an overhead contact line is not only an electrical feeder. It is also a long, tensioned mechanical structure that has to respect the structural gauge, the pantograph working range, wind deflection, support stiffness, wire wear, tunnel and bridge clearances, and the dynamic response caused by passing trains.
13.2 History
The evolution of the catenary system mirrors the history of electric traction:
- 1879
-
First electric locomotive (Siemens & Halske, Berlin): power via underground rail, unreliable and dangerous.
- 1882
-
First overhead installation: side-mounted conductor for the Berlin-Westend tramway (Siemens).
- 1889
-
Invention of the pantograph by Walter Reichel (Siemens).
- 1901
-
First AC traction: 3-phase 10 kV 50 Hz on the Marienfelde–Zossen line; speeds of 210 km/h achieved in 1903.
- 1903
-
First catenary-suspended contact wire (AEG): AC 6 kV 25 Hz on the Niederschoeneweide–Spindlersfeld line; V-type droppers achieve nearly constant contact wire height.
- 1911–1913
-
First \(15\,\mathrm{kV}\), \(16\tfrac{2}{3}\,\mathrm{Hz}\) single-phase operation\ on the Dessau–Bitterfeld line (1911); at the turn of 1912/1913 the German state railways adopted this voltage and frequency as their common standard, and it later became the Scandinavian standard as well.
- 1926
-
Comprehensive standardisation: contact wire height, system height, dropper spacing, span length, stagger and overlap design.
Early systems experimented with underground conductors, side conductors, DC supplies and multi-phase AC. The decisive step for mainline railways was the combination of high-voltage AC supply, overhead contact wires and a pantograph collector. Once contact wire height, system height, dropper spacing, span length and stagger were standardised, the catenary system became a repeatable railway infrastructure system rather than a local experimental installation.
13.3 Power Supply
Electric traction power can be supplied by DC or AC. DC systems use lower voltages and therefore require larger currents and conductor cross-sections for the same train power. AC systems allow higher voltages and lower currents, which is favourable for long distances and high power demand. Norway's 15 kV 16.7 Hz system is retained for compatibility with the existing network, while many newer European high-speed lines use 25 kV 50 Hz.
The traction supply system includes converter or transformer stations, feeders, switchgear, protection equipment, remote control and the return-current circuit. The location and capacity of supply stations depend on train power demand, traffic frequency, gradients, line speed, regenerative braking and acceptable voltage drop. The overhead contact line is therefore the visible part of a larger traction power system. Table 13.2 summarises the main system-level arguments for and against electrification; most of the disadvantages are infrastructure-side costs, while most of the advantages appear on the vehicle and operating side.
| Advantages | Disadvantages |
|---|---|
|
|
Regenerative braking is an important benefit of electric traction. On downhill sections, a train can return energy to the traction power system; that energy can then be used by another train if the network and operating situation allow it. The benefit is especially clear on steep freight routes such as ore lines, where loaded trains descend in one direction and empty trains climb in the other.
13.4 Working Principle
The objective of traction power supply is uninterrupted, reliable and safe operation of electric trains. The traction power chain can be divided into five functions:
-
Traction power generation: power is drawn from the national grid or dedicated traction frequency converters for the Norwegian network, and stepped up by transformer substations along the line.
-
Traction power feeding: the high-voltage AC current is distributed to the contact wire via feeder cables and AT (autotransformer) cables.
-
Traction power transmission: the contact wire carries the current along the track within each tensioning section.
-
Return current circuit: traction current returns via the running rails and dedicated return cables to the substation [73].
-
Traction power collection: the train's pantograph slides along the contact wire, forming the only connection between the fixed infrastructure and the moving vehicle.
Figure 13.3 maps the same five-stage chain, separating the traction supply path from the return-current path through the rails and return conductors.
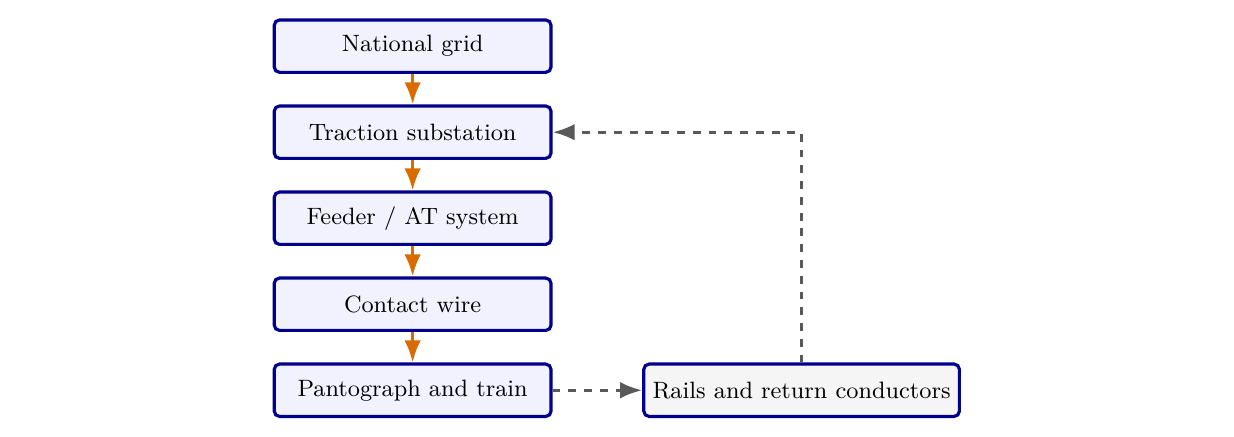
The moving part of this chain is the train and pantograph; the feeding equipment is fixed to the ground. Reliable operation is achieved only when the contact point between pantograph and contact wire remains in the correct position and under the correct force. Any contact loss, hard impact or contact with fittings rather than the contact wire can cause arcing, wear, damage and eventually system failure.
Norwegian overhead contact-line systems are distinguished mainly by their permitted speed, whether a stitch wire is used, and the design tension in the contact and messenger wires. Table 13.3 gives the representative Norwegian systems most often used when discussing pantograph–overhead-line compatibility in this chapter. The contact wire (CW) is the lower conductor touched by the pantograph, while the messenger wire (MW) is the upper carrying wire that supports the contact wire through droppers. The label Tabell 54 is retained because older Norwegian project material uses the table number in the Bane NOR specification as shorthand for this legacy catenary arrangement; it should not be read as a separate system number. Older labels such as System 20 B, System 20 C and System 35 should be checked against the current project-specific system documentation before use.
| System | Stitch wire | Max speed [km/h] | CW tension [kN] | MW tension [kN] |
|---|---|---|---|---|
| Tabell 54 | No | 130 | 4.9 | 6.13 |
| System 20 A | Yes | 200 | 10 | 10 |
| System 25 | Yes | 250 | 15 | 15 |
13.5 System Components
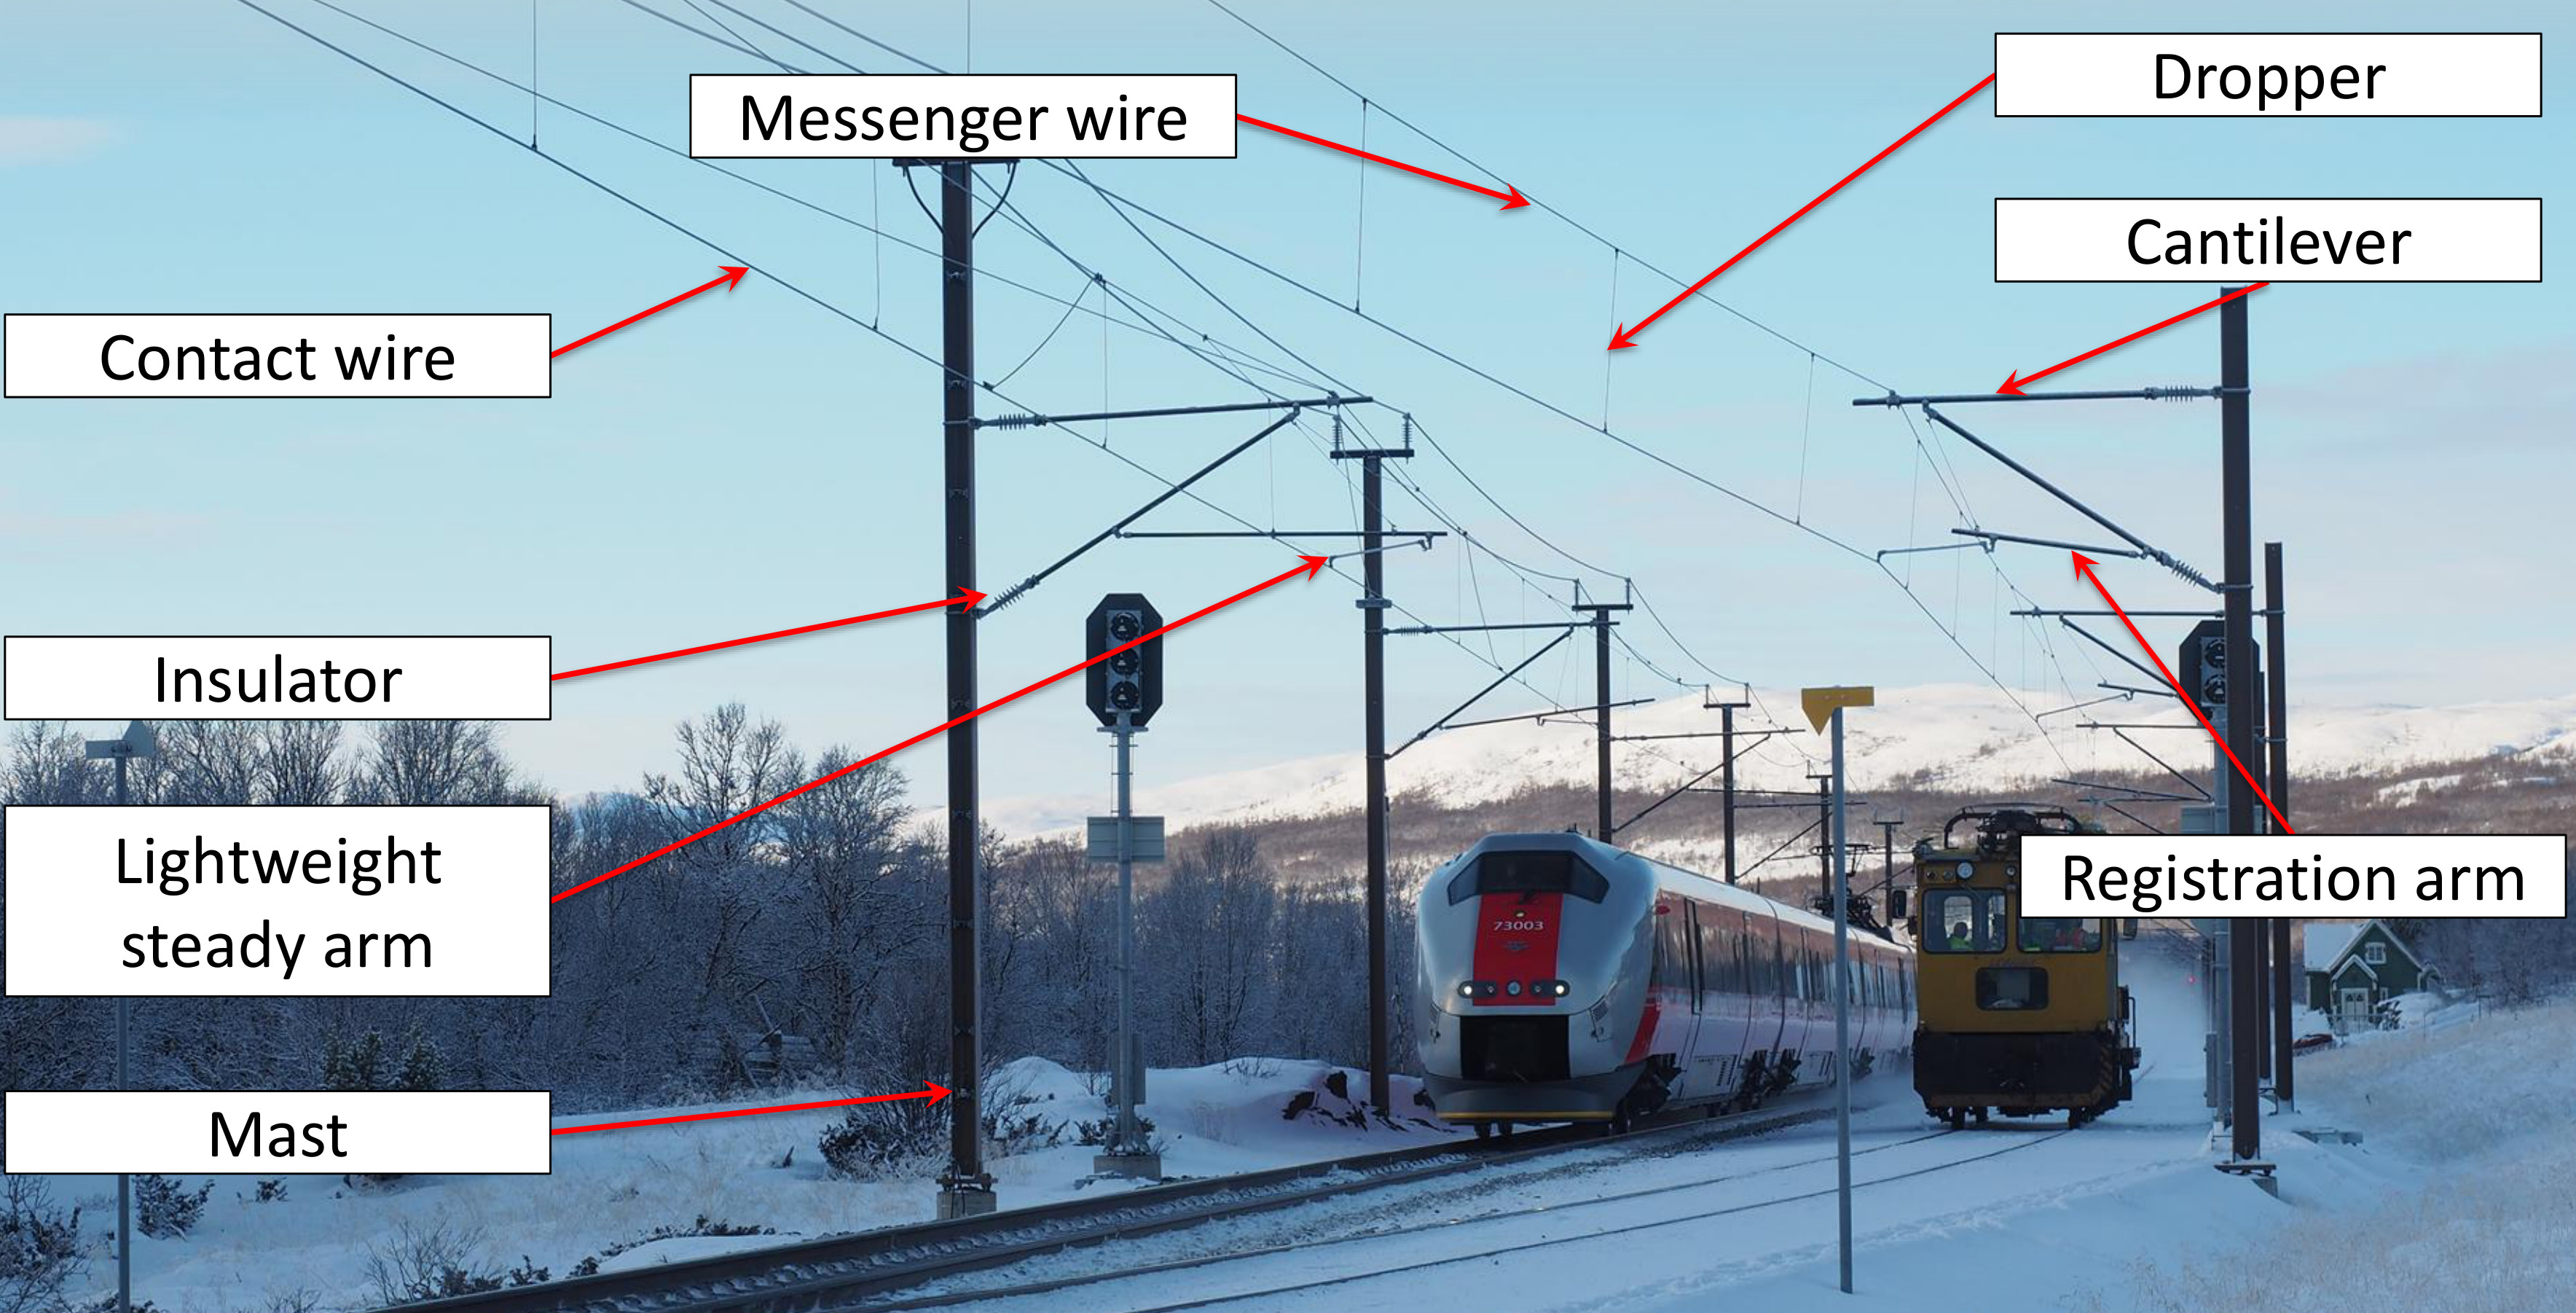
Figure 13.4 labels the nomenclature used in the component descriptions below. The catenary is best understood as one interacting system: the contact wire conducts current and touches the pantograph, the messenger wire and droppers control height, the cantilever controls lateral position, and the mast or portal transfers loads to the foundation.
13.5.1 Contact Wire
The contact wire (CW) is the main electrical interface with the train. It is a copper or copper-alloy wire with a grooved cross-section so it can be clamped without interrupting the sliding surface used by the pantograph. Typical contact wire cross-sections are about \(100\text{--}120\,\mathrm{mm^2}\), and typical Norwegian mainline tensions are in the range 10–15 kN depending on the catenary system.
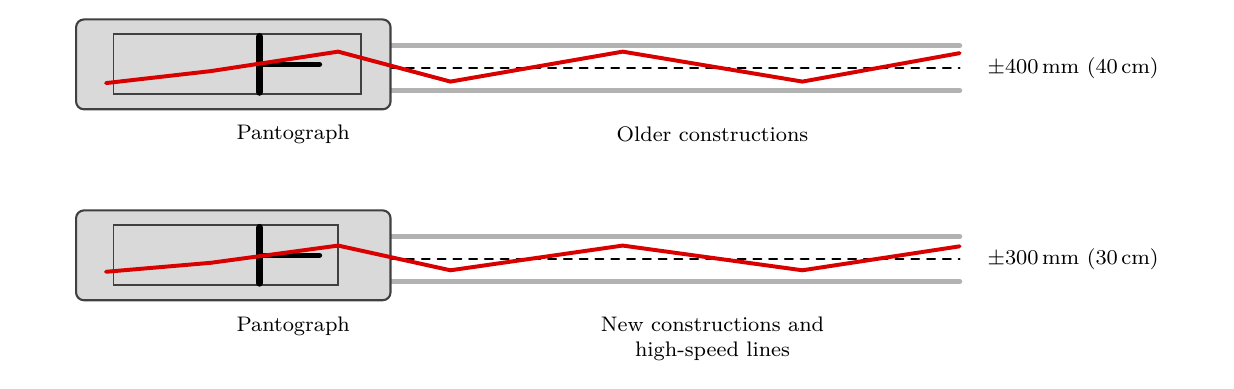
The contact wire is not placed exactly on the track centre line at every support. Instead, it is mounted with a controlled lateral displacement called stagger. Alternating the stagger direction moves the contact point across the pantograph collector strip and distributes wear, producing the zig-zag wire path shown in Figure 13.5. On straight track, the nominal stagger shown is about \(\pm 400\) mm for older constructions and about \(\pm 300\) mm for newer System 20/25 and high-speed arrangements, giving better dynamic stability and wind margin.
13.5.2 Messenger Wire and Droppers
The messenger wire (MW) supports the contact wire through droppers. The droppers are vertical or near-vertical wires installed at regular intervals, and their lengths are chosen so that the contact wire remains at the required height even though the messenger wire sags between supports. This arrangement is what makes a modern catenary different from a simple suspended wire.
Temperature changes lengthen and shorten the wires. If this movement were not controlled, the wire tension, sag and contact-wire height would vary too much between summer and winter. Tensioning devices, often with weights, pulleys, springs or fixed anchor arrangements, keep the contact wire and messenger wire at the required mechanical tension.
13.5.3 Cantilever
Cantilevers are mounted on masts along the track. Their purpose is to register the lateral position of the contact and messenger wires, transfer catenary loads to the mast, and avoid excessively long unsupported spans. A cantilever can be a push-off type or a pull-off type depending on its position relative to the track centre line and the required direction of the stagger. In Figure 13.6, the solid registration arm is the pull-off configuration and the dashed alternative is the push-off configuration.
![Push-off and pull-off cantilever registration [97].](../../assets/chapters/ch13/original/figures_lecture_crops/fig_cantilever_push_pull_patent.png)
In open line, one mast normally carries one cantilever. In overlap zones and at switches, the same mast may carry two cantilevers, each serving a different contact wire group. In tunnels, cantilevers may be mounted from the tunnel wall or from supports hanging from the ceiling.
13.5.4 Pantograph
The pantograph is mounted on the train roof and transfers current from the contact wire to the vehicle. It consists of a collector head with contact strips, upper and lower arms, a lifting mechanism and insulators. The lifting mechanism keeps the collector pressed against the contact wire while allowing the pantograph to follow height changes and dynamic movement. Figure 13.7 labels these main parts on a roof-mounted pantograph.
![Main pantograph components [137].](../../assets/chapters/ch13/original/figures_lecture_crops/fig_pantograph_components_lecture.jpg)
The contact strip is commonly made of carbon-based material. Carbon provides good electrical contact and favourable sliding behaviour, but it still wears, especially when contact force is too high or when contact loss causes arcing.
13.5.5 Poles
Poles or masts support the catenary system and may have different functions:
-
Suspension poles: carry one cantilever and the ordinary contact-line loads.
-
Tensioning poles: carry cantilevers and tensioning-device forces, often with stays.
-
Intermediate poles: carry two cantilevers inside overlap sections.
-
Midpoint poles: carry midpoint anchor loads.
-
Midpoint anchor poles: terminate midpoint anchors and resist longitudinal forces.
Norwegian practice, as listed in Bane NOR's current contact-line regulation, includes wooden poles, B-masts, H-masts, beam masts, concrete masts, tunnel supports and portal structures, depending on location, load level and foundation conditions [38].
13.5.6 Portal Structures
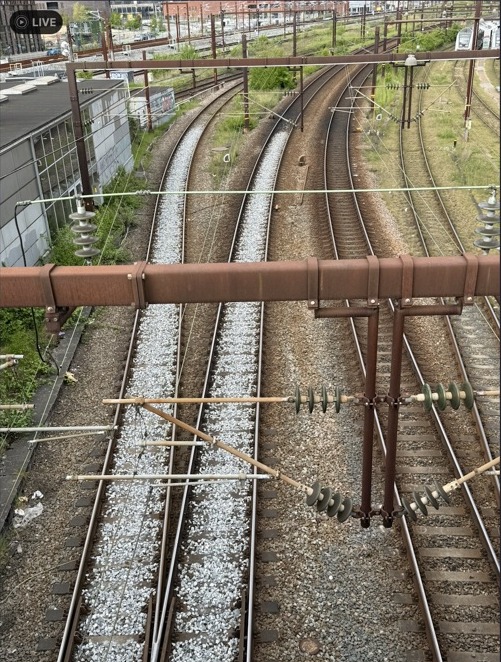
Portal structures are used where catenary equipment must be supported above more than one or two tracks. They may be lattice beams or solid girder structures supported by columns. Portals are common in station areas, yards and other multi-track locations where individual masts beside each track would be impractical. Bane NOR uses the term åk for these structures. The regulation describes an åk as a truss supported at both ends, used to cover more tracks than a single mast can manage. Typical Bane NOR portal types cover about 10–16 m, 11–33 m or 28–43 m, depending on the portal type and the number of contact lines carried [38]. Figure 13.8 shows the same basic idea: side supports, a transverse beam and suspended contact-line equipment.
13.6 Catenary System Design
13.6.1 Regulations
The relevant framework combines contact-line, electrical safety, rolling-stock interface and structural requirements. Railway projects must follow the current Bane NOR requirements, project system descriptions, standard drawings and approved component documentation. For this introductory chapter, the important sources are:
-
Bane NOR technical regulations define national requirements for power supply, contact-line geometry, maintenance limits, earthing, documentation and interfaces [37].
-
TSI Energy sets interoperability requirements for the energy subsystem, including voltage/frequency, current collection and energy metering.
-
EN 50119 governs overhead contact-line design principles, including contact-wire geometry and mechanical requirements [74].
-
EN 50122 governs electrical safety, earthing and the return-current circuit [73].
-
EN 50367 defines criteria for pantograph–catenary interaction, including contact-force quality and acceptance parameters [75].
-
Structural load combinations for poles, portals and foundations must include dead load, wind, snow, ice, temperature, tensioning forces and relevant maintenance or accidental cases.
13.6.2 Sections
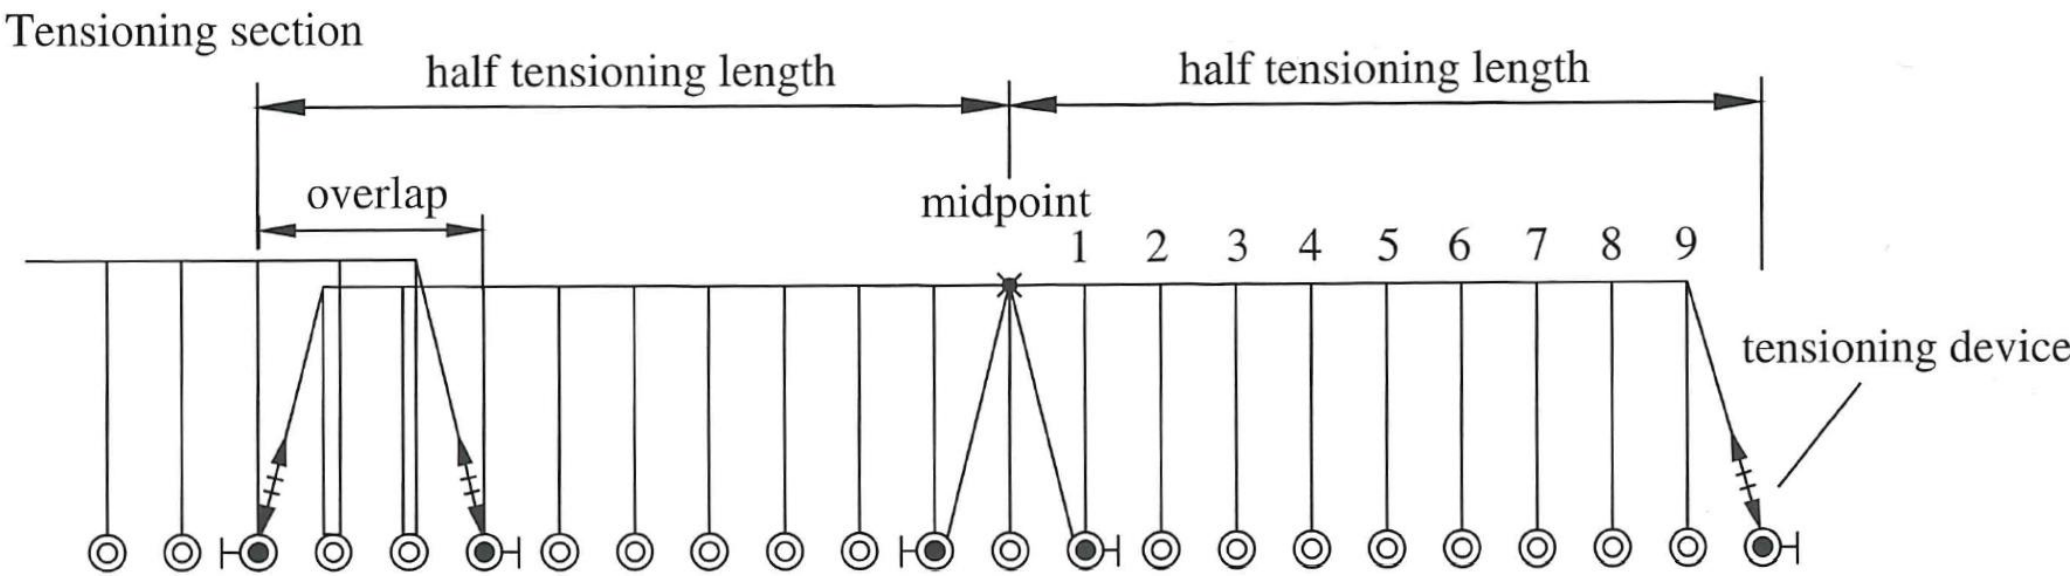
A catenary system is divided into tensioning sections rather than installed as one continuous wire along the whole line. A section can be up to approximately 1500 m long, depending on the tensioning arrangement, temperature range, span layout, track curvature, wind exposure and the working range of the tensioning devices. Figure 13.9 shows a typical section, with tensioning devices at both ends, a midpoint anchor, and overlaps to the neighbouring sections.
Within each section:
-
The contact and messenger wires are pulled from both ends by tensioning devices.
-
The midpoint anchor prevents wire creep towards one end.
-
Adjacent sections overlap: in the overlap zone, two parallel contact wires run at the same height so the pantograph transitions smoothly from one section to the next.
Best practice is to have an odd number of spans in the overlap so that the middle of the overlap falls between two poles. This avoids placing the crossing of the two contact wires at a very rigid support point. A section is then divided into spans, typically 50–70 m for ordinary open-line applications. The maximum usable span length is limited by pantograph working range, wire tension, wind speed, track radius, stagger and permissible contact-wire displacement.
13.6.3 Cables and Wires
Catenary cables and wires are normally made from copper or copper alloys, although other materials may be used for specific components. The contact wire has a grooved profile so it can be held by clamps while the pantograph runs on a smooth lower surface. Messenger wires and feeder cables are commonly stranded conductors, which gives flexibility while maintaining the required electrical and mechanical capacity. Figure 13.10 shows the two forms side by side.
![Contact-wire profile and stranded catenary conductors [134].](../../assets/chapters/ch13/original/figures_lecture_crops/fig_contact_wire_profile_conductors_lecture.jpg)
The choice of material and cross-section depends on electrical conductivity, tensile strength, wear behaviour, corrosion resistance and current level. DC systems need larger conductor cross-sections than AC systems because the same power is transmitted at lower voltage and therefore higher current.
13.6.4 Limit States
Limit-state design provides the criteria for checking that a catenary system is both functional in service and structurally safe under governing loads. The serviceability limit state (SLS) concerns whether the train can collect current reliably under normal operation: wire height, stagger, wind deflection, uplift and contact-force variation must stay within acceptable limits. The ultimate limit state (ULS) concerns structural safety: poles, foundations, cantilevers, tensioning devices and anchors must resist the governing combinations of wire tension, environmental actions and equipment loads without collapse. A design must satisfy both criteria. A structurally strong catenary can still perform poorly if its dynamic elasticity or lateral geometry is irregular.
13.6.5 Wave Propagation Speed and Maximum Train Speed
A pantograph moving along the contact wire acts as a moving load that excites transverse waves in the wire. The wave propagation speed is:
where \(H_0\) is the mechanical tension in the contact wire [N] and \(m'_{CW}\) is the linear mass of the contact wire [kg/m]. For an AC-100 Cu contact wire at 10 kN tension, \(c_p \approx 380\) km/h.
As train speed approaches \(c_p\), the wave reflected from the preceding support reinforces the pantograph excitation, leading to large-amplitude oscillations and repeated contact loss. This defines the absolute speed limit for a given catenary system. Practical experience limits the maximum train speed to approximately 70% of \(c_p\) to maintain acceptable contact quality.
Higher wire tension, as used in System 25, increases \(c_p\) and is one reason why high-speed catenary systems require higher contact-wire and messenger-wire tension.
13.6.6 Clearance Gauges
The contact wire position cannot be designed without considering vehicle and infrastructure gauges. The basic hierarchy is:
-
Vehicle construction profile: the vehicle and load envelope.
-
Reference or dynamic profile: the envelope including vehicle movement effects.
-
Structure gauge: the infrastructure space kept free around the track, including required safety margins.
-
Pantograph gauge: the additional upper envelope needed for the pantograph and live overhead contact-line equipment.
Figure 13.11 repeats the gauge hierarchy from Chapter 12 for the catenary context. In the figure, A denotes the vehicle profile, B the reference or dynamic profile, C the structure gauge and D the pantograph gauge. For catenary design, this hierarchy controls the available space for the pantograph, contact wire, messenger wire, insulators and support equipment. Bane NOR's profile rules require electrified lines to satisfy the ordinary train-passage gauge and the separate free pantograph profile or Cross-section E [49, 39].
![Gauge hierarchy and pantograph envelope [49, 39].](../../assets/chapters/ch13/original/figures_lecture_crops/fig_gauge_profiles_hierarchy_ch12.png)
13.6.7 Vertical Geometry
Once the clearance gauge is known, the vertical position of the contact wire can be checked between two limits:
-
Lower limit: electrical clearance to vehicle roof and pantograph in the lowest position.
-
Upper limit: maximum height that the pantograph can reach while maintaining acceptable contact.
The vertical geometry is influenced by dead load, wind, snow, ice, temperature, pre-tension, dropper layout and pantograph uplift. Low bridges, tunnels and other obstacles may require special arrangements, but the contact wire height must still change gradually enough to avoid impact and excessive wear.
Current Bane NOR control values are system-specific and depend on when the installation was built. For contact-line systems built after 1 January 2016, System 25 is checked in a relatively low high-speed height window, approximately 5070–5130 mm, while System 20 is checked in a wider traditional window, approximately 5020–5630 mm [37]. Older installations have different values, and constrained tunnels, bridges and snow sheds may have documented dispensations; such exceptions are still not to be treated as normal design values. At level crossings the contact wire height must not be below 5500 mm.
On long lines, the contact wire height often changes between sections. The maximum permitted gradient in contact wire height is regulated by EN 50119 [74]. Bane NOR expresses the height-change check as:
where \(v\) is the maximum speed in km/h and \(\Delta H\) is the dimensionless gradient ratio. For example, at \(v=200\) km/h, \(1/(5v)=1/1000=1\) ‰ for a middle span and \(1/(10v)=1/2000=0.5\) ‰ for a transition span.
13.6.8 Lateral Geometry
The lateral geometry must keep the contact wire within the working width of the pantograph collector. The stagger pattern depends on pantograph width, track curvature, wind zone, span length and permitted lateral displacement. In sharp curves, the stagger may have to be placed consistently on one side instead of alternating symmetrically.
Cross-wind displaces the wire laterally in the midspan. Higher wind zones require shorter span lengths or reduced stagger so that the contact wire remains inside the pantograph working range under the governing wind condition.
In Bane NOR's current maintenance checks, the designed stagger is taken from the valid installation documentation. For System 25 and System 20 A/B/C, the allowed deviation at a mast is \(\pm 30\) mm; for other systems it is \(\pm 50\) mm [37]. This illustrates a general design principle: the number on the drawing is not enough by itself, because wind displacement, curvature, support movement and construction tolerance all consume the same pantograph working margin.
13.6.9 Elasticity
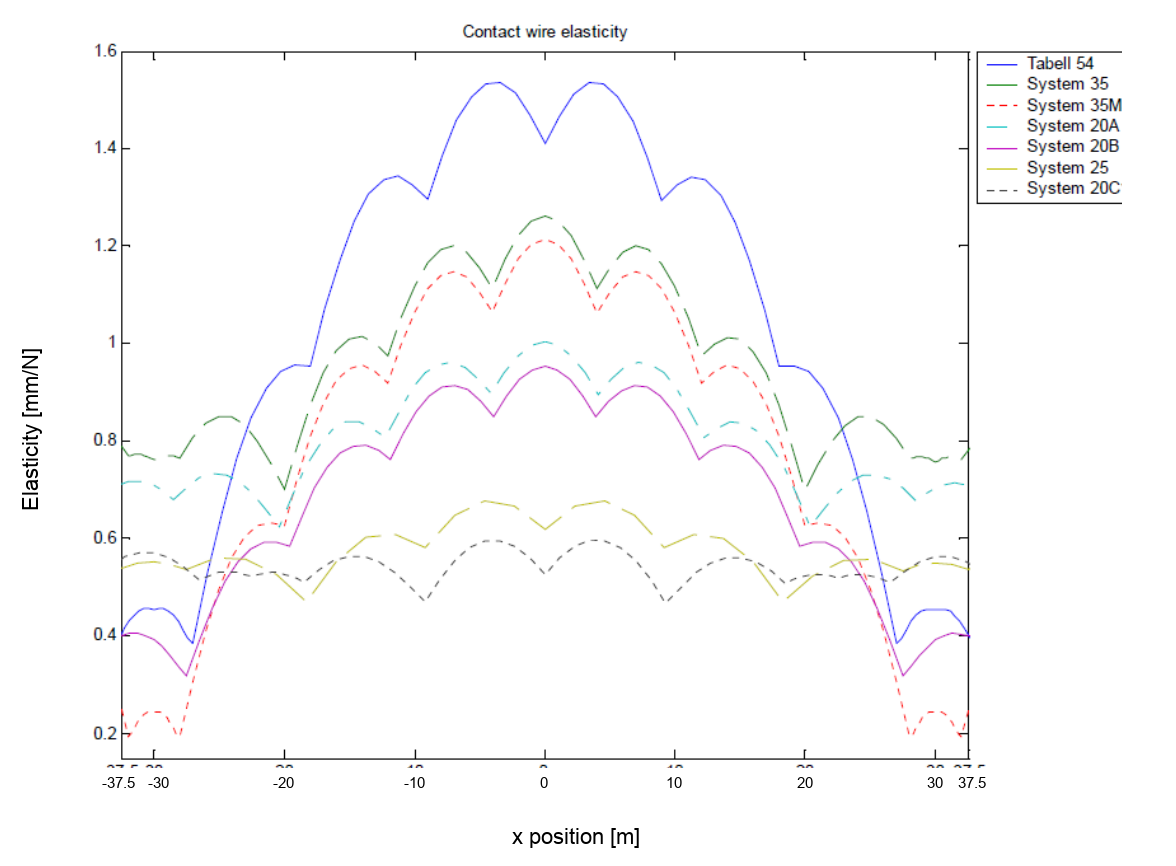
The elasticity of the catenary, its ability to deflect under pantograph force, must be as uniform as possible along the span. An elastic support point (midspan) and a stiff support point (at the pole) would create large contact force variations. Key parameters:
-
Span length (typically 50–70 m for open line): shorter spans increase stiffness and reduce mid-span sag.
-
System height: the vertical distance between the messenger wire and the contact wire at the support. A greater system height gives a more uniform contact wire height.
-
Dropper number and spacing: more droppers reduce the contact wire sag between supports.
-
Stitch wire: used in high-speed systems to reduce the stiffness difference between the dropper attachment point and the midspan.
-
Wire tension: higher tension reduces sag and increases wave propagation speed.
Span lengths should not be uniform throughout a long section, to avoid periodic resonance. However, they should not vary too much either, as large differences in adjacent span lengths introduce sudden changes in dynamic stiffness. The elasticity curves in Figure 13.12 highlight the principal dynamic behaviour: every system alternates between stiffer support regions and more flexible midspan regions, and the pantograph experiences that variation as a repeated dynamic excitation.
13.6.10 Switches
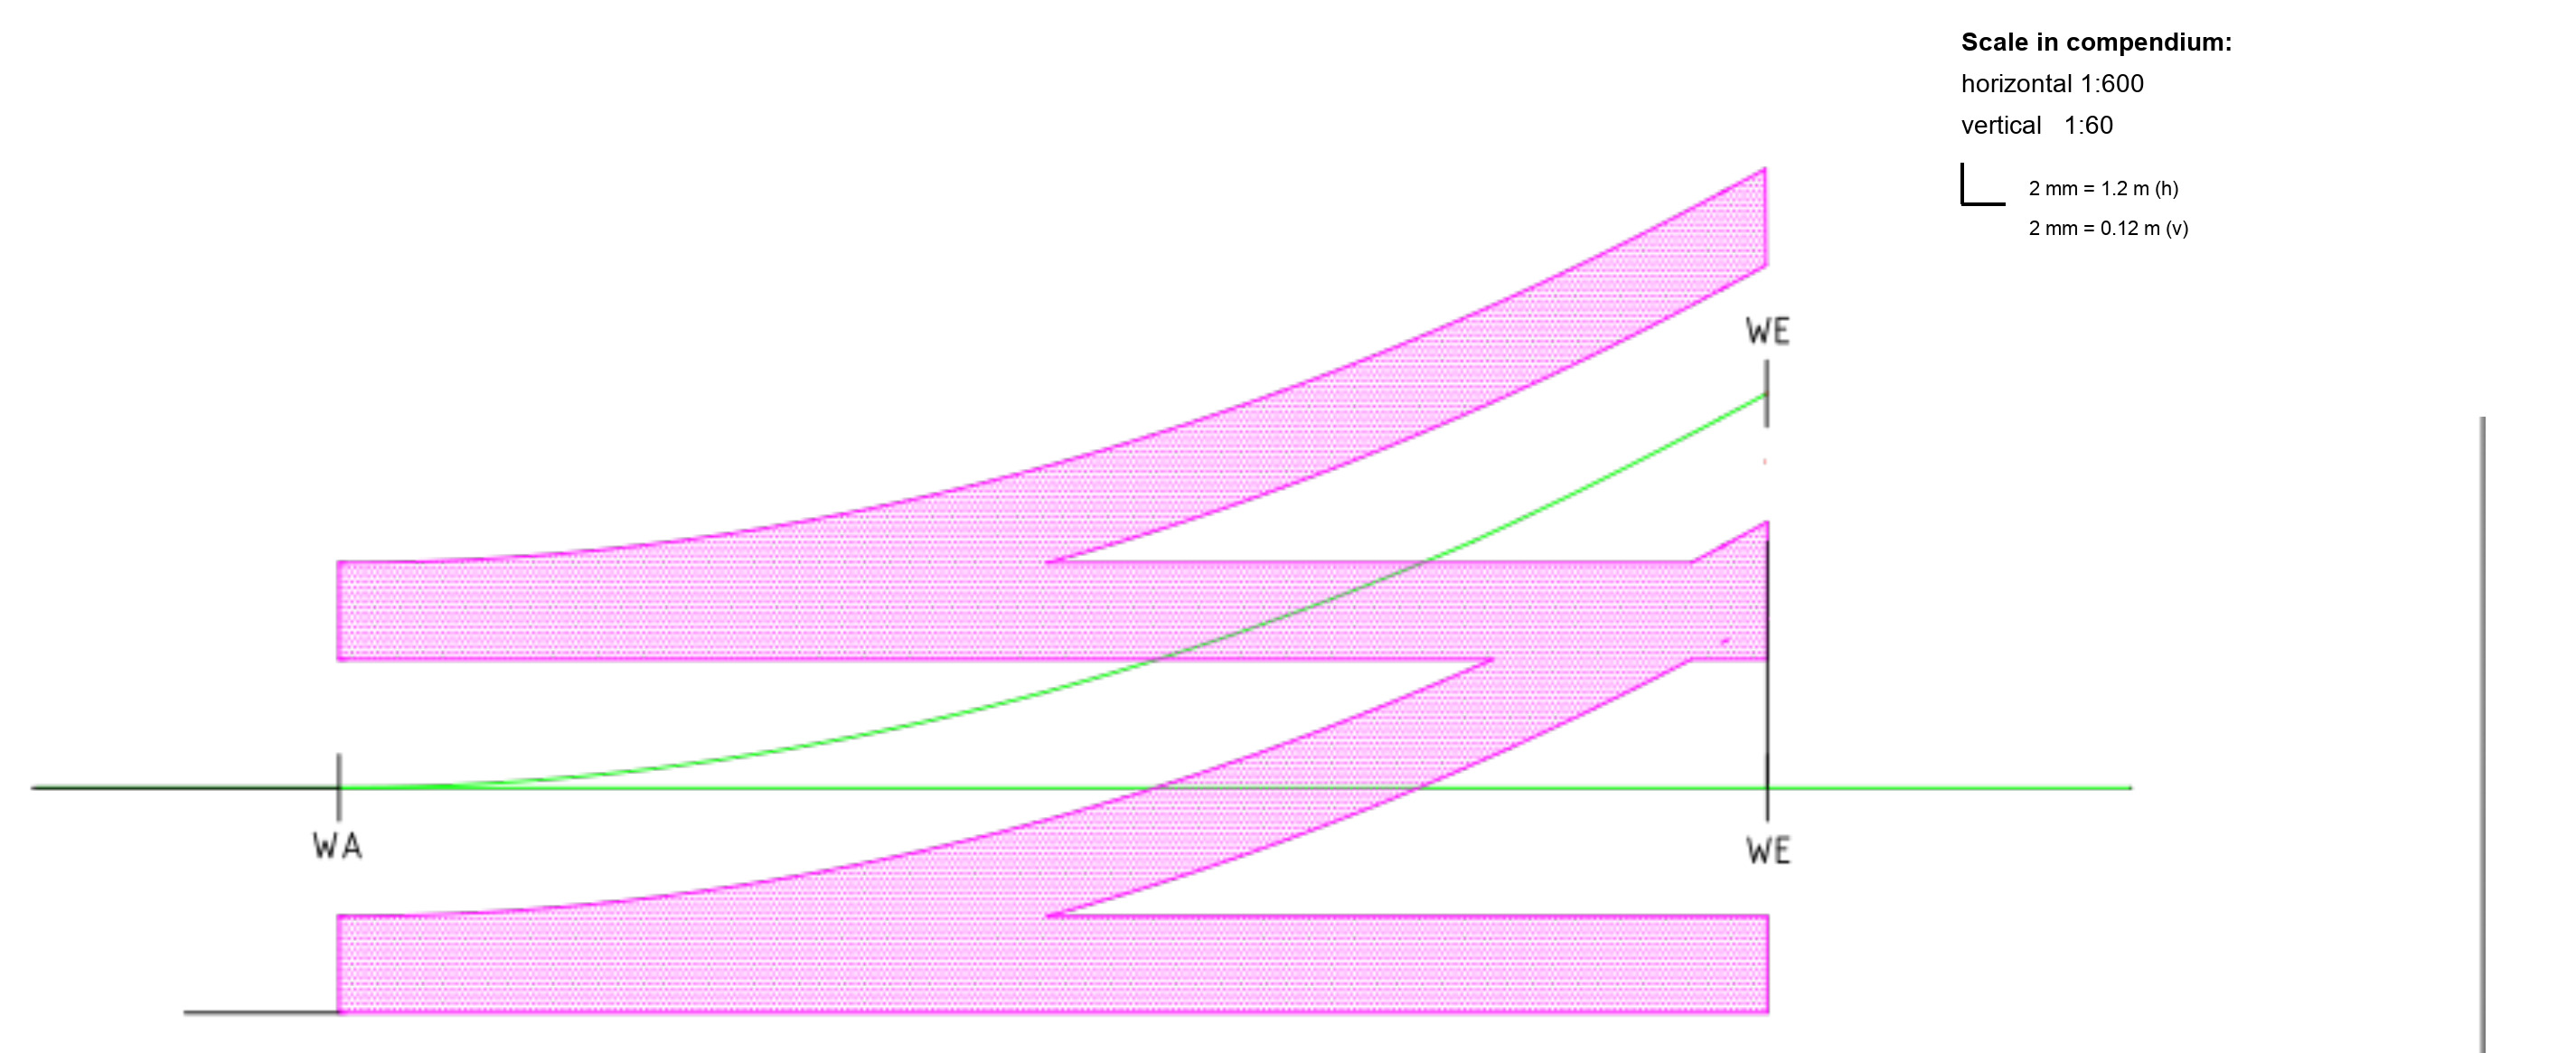
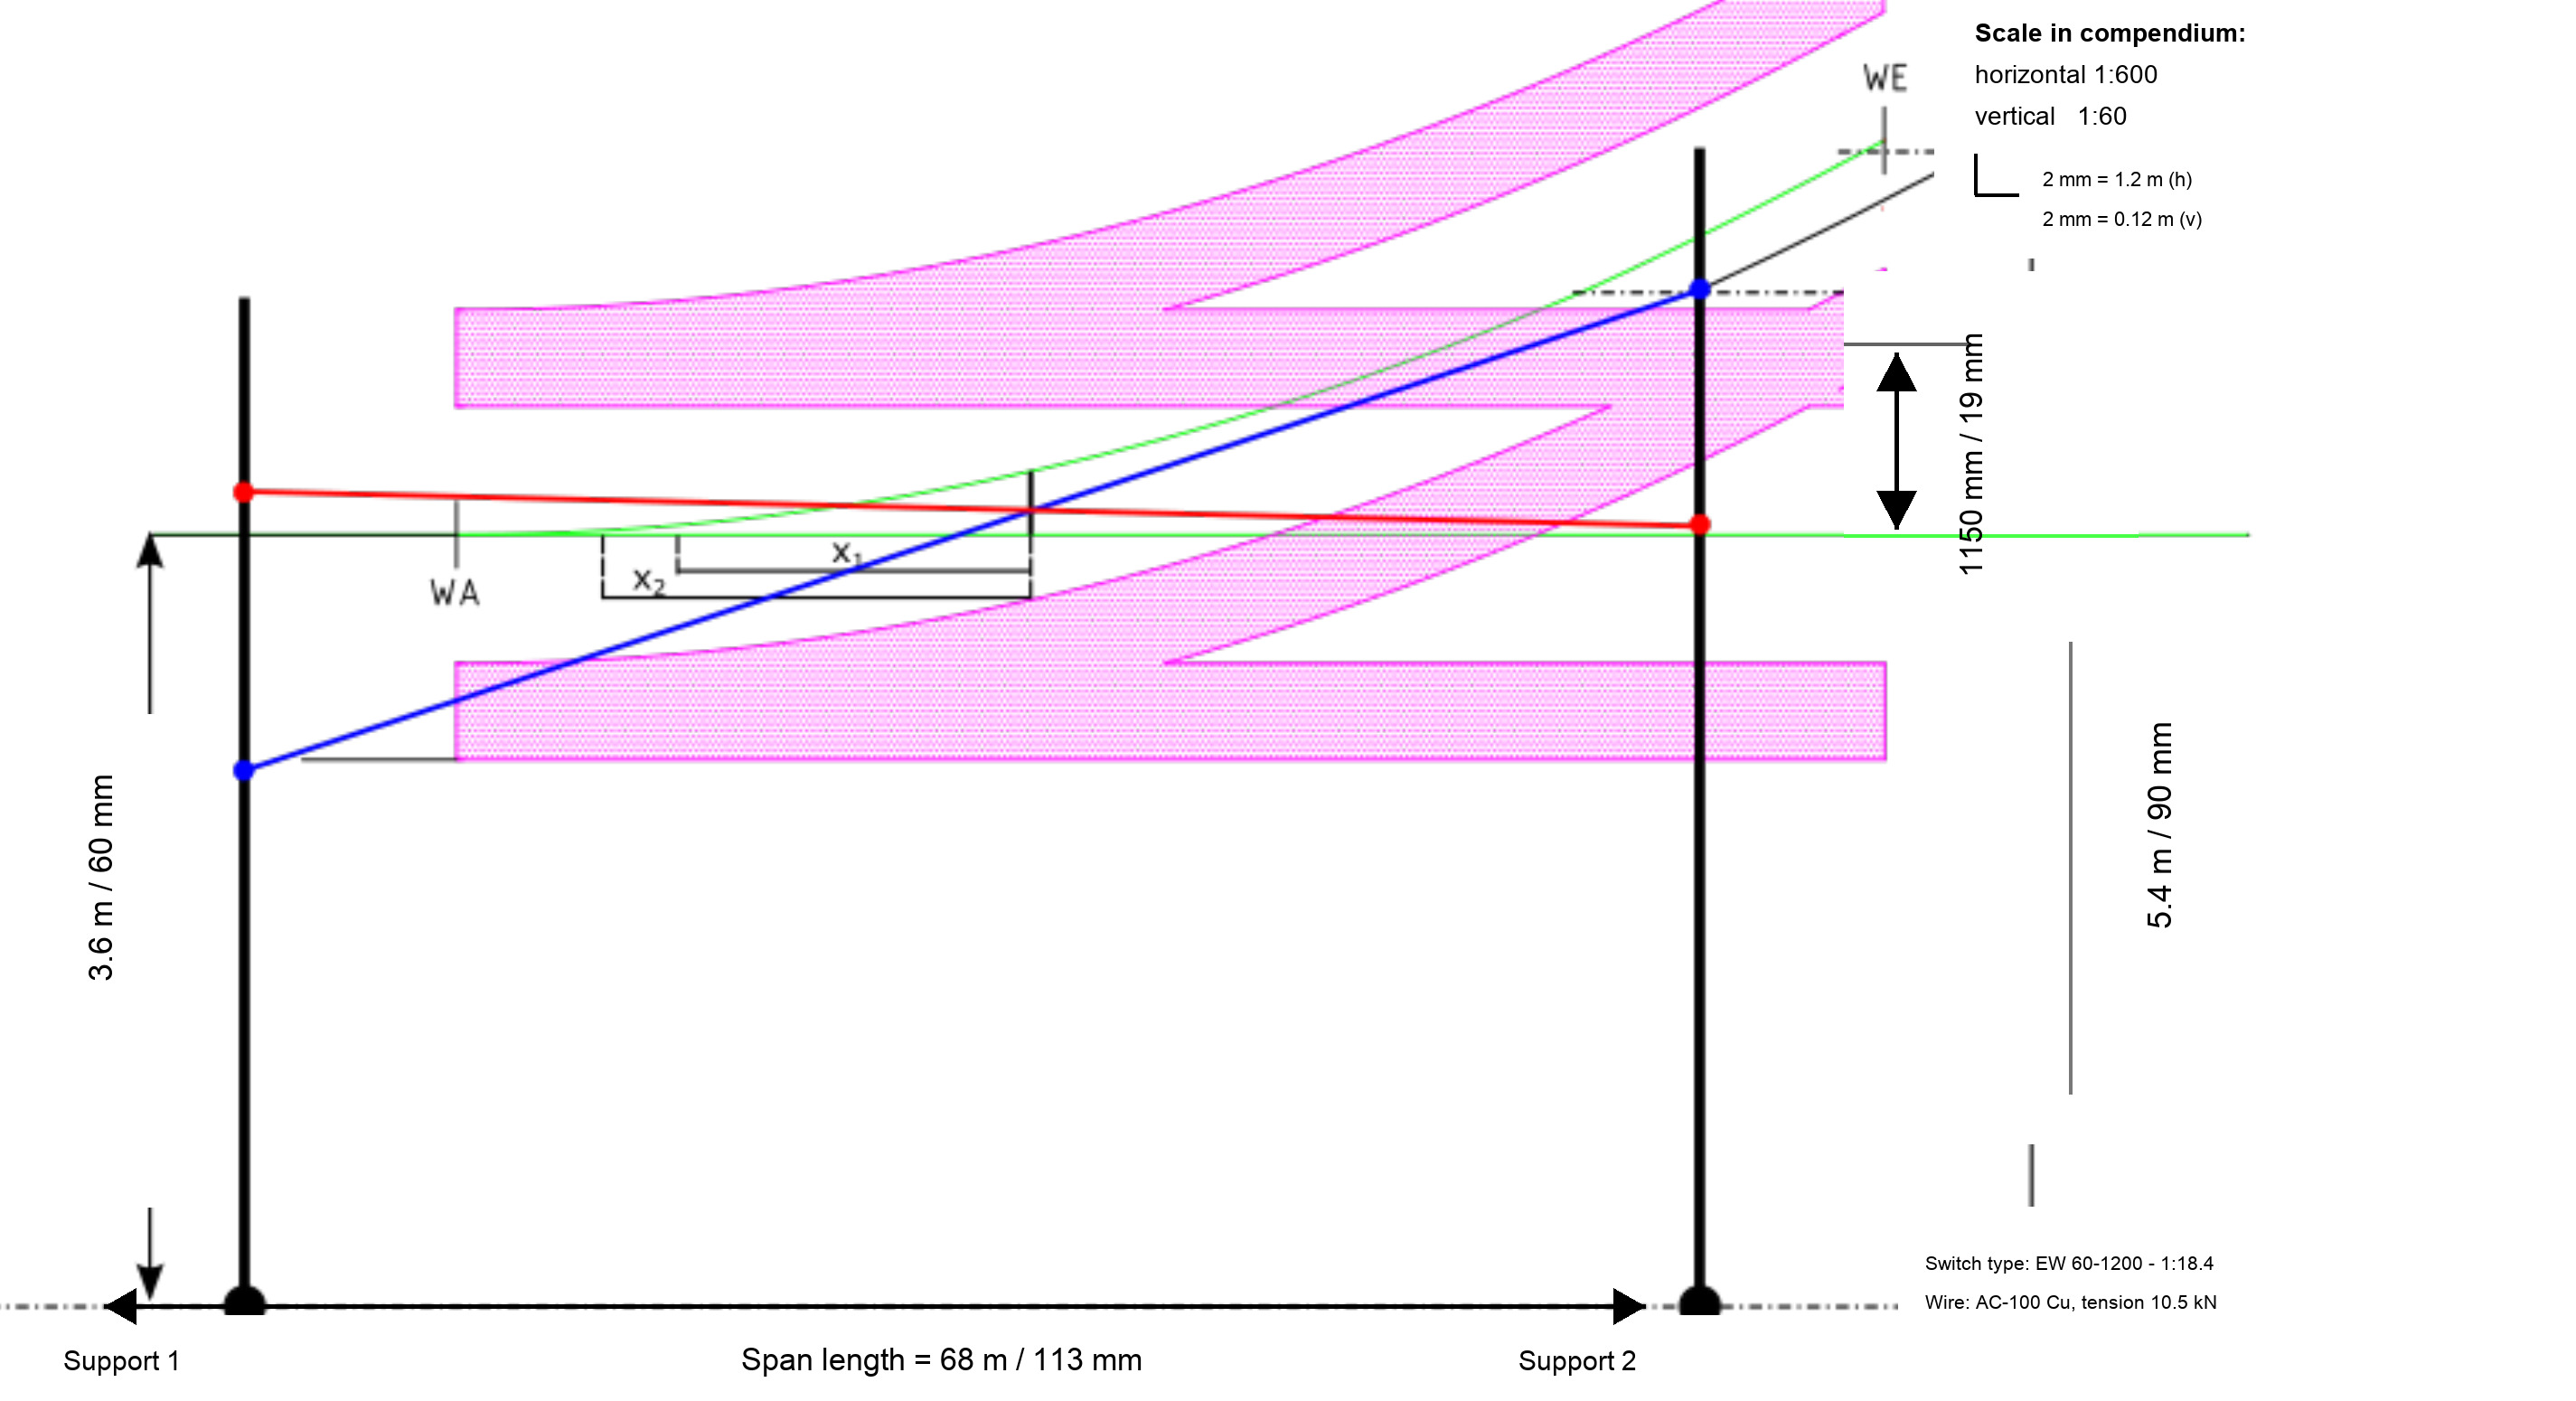
Wiring of switches creates higher contact forces between pantograph and contact wire, especially at high speed. The causes are concentrated masses at wire crossings, the pantograph being in contact with several wires, radial forces and local sections with low elasticity. Designing the catenary at switches and crossings is therefore one of the most complex catenary tasks. Exact dimensions must be taken from the current system drawings and project requirements. The sequence below summarises the checking logic for a simplified design example. Figure 13.13 shows the starting drawing used before the contact wires and supports are placed. The green lines are the track axes, the magenta areas are the fitting-free zones for the pantograph, and the scale is kept consistent between the planning template and the finished layout. The ten steps below explain how this blank planning template is developed into the final contact-wire layout in Figure 13.14.
13.6.10.1 Worked Example: Switch Uplift Distance
Question. An AC-100 copper contact wire is tensioned to \(H_\mathrm{CW}=10.0\) kN and has a weight per unit length \(G'_\mathrm{CW}=8.46\) N/m. After the contact wires cross above a turnout, determine the horizontal distances required for the side-track wire to rise by 110, 160, and 460 mm. These uplift levels correspond to the switch-layout control points \(x_1\), \(x_2\), and \(x_3\).
For the simplified parabolic-wire model, the rise \(\Delta z\) and horizontal distance \(x\) are related by
where \(\Delta z\) is entered in metres, \(H_\mathrm{CW}\) in newtons, and \(G'_\mathrm{CW}\) in newtons per metre.
Step 1: convert the uplift values.
Step 2: calculate the three distances.
Interpretation. The wire does not become safely separated immediately after the crossing. The calculated \(x_1\) and \(x_2\) positions constrain the support and clamp zones, while \(x_3\) indicates where the lifted wire reaches the larger clearance level. The result is specific to the wire tension and unit weight; another contact-wire type requires the same calculation with its own parameters. A complete two-track switch layout extends this one-dimensional check by coordinating both contact wires, crossings, support zones, and clearances.
The simplified design procedure follows ten steps. The first four steps define the reference geometry; the last six steps use that geometry to choose support and clamp positions.
-
Draw the two track centre lines. The through route and the diverging route are first copied from the turnout drawing. In Figures 13.13 and 13.14 these are the green lines. All lateral offsets are then measured from the nearest track centre line, not from the edge of the paper.
-
Define the clamp-free zone. This is the magenta zone in the figures. For a 1950 mm pantograph collector strip, no clamps are placed within \(\pm 600\) mm of each track centre line. Between 600 mm and 1050 mm, only fittings that cannot catch the raised pantograph horn are permitted. The zone is drawn along both routes, because either route may carry a raised pantograph.
-
Establish the turnout crossing reference point. Move along the turnout until the two track centre lines are about 300 mm apart, measured perpendicular to the tracks. This point is used as the working reference for the contact-wire crossing because it keeps the wire positions within the allowable stagger range.
-
Calculate and mark \(x_1\) and \(x_2\). After the two contact wires cross, the side-track wire must rise above the through-track wire so that a raised pantograph cannot catch it. The points \(x_1\) and \(x_2\) are the distances from the crossing reference point to where the side-track wire has reached 110 mm and 160 mm vertical uplift. For the AC-100 copper worked example above, these values are \(x_1=16.13\) m and \(x_2=19.45\) m. On the reproduced Figure 13.14 scale this corresponds to approximately 27 mm and 32 mm measured on the drawing.
-
Define the allowable clamp zone at support 2. The side-track clamp must be outside the clamp-free zone, beyond the \(x_1\) and \(x_2\) constraints, and close enough to the mast that a practical cantilever can be used.
-
Choose the side-track contact-wire clamp at support 2. This fixes the side-track wire stagger at the right-hand support.
-
Choose the through-track contact-wire clamp at support 2. This fixes the through-track wire stagger at the same support and checks that the two wires separate cleanly after the crossing.
-
Determine the span length and place support 1. The support spacing must be compatible with the catenary system, wire tension, turnout geometry and available mast locations. In the example the span is about 68 m.
-
Choose the side-track clamp at support 1. This completes the blue side-track contact-wire line in Figure 13.14.
-
Choose the through-track clamp at support 1. This completes the red through-track contact-wire line and gives the final layout to be checked against stagger, clamp-free-zone and cantilever limits.
After the steps have been applied, Figure 13.14 shows the resulting layout. The red and blue contact wires approach on their own staggers, cross near the turnout reference point, and then separate so that each wire is lifted clear of the pantograph path for the other route. The black support lines show the chosen mast positions; each clamp must lie outside the magenta zone unless the fitting is explicitly allowed for pantograph passage.
13.6.11 Forces Calculation
Foundation and support design must include both permanent system forces and environmental loads. Table 13.4 summarises the main load groups.
| Group | Examples and design relevance |
|---|---|
| Permanent and system loads | Self-weight of contact wire, messenger wire, droppers, stitch wires, feeder or AT cables, cantilevers, poles and portals. These govern basic support reactions and foundation sizing. |
| Tensioning and alignment forces | Contact-wire and messenger-wire tension, curve pull, midpoint anchors and overlap arrangements. These create longitudinal and lateral forces in poles and anchors. |
| Environmental loads | Wind, snow, ice and temperature variation. These can control span length, stagger margin, tensioning-device working range and foundation loads. |
| Dynamic effects | Pantograph contact force, support uplift, dynamic amplification near concentrated masses, and local impact effects at overlaps or switches. These govern contact quality and acceptance. |
The practical planning sequence is to identify fixed points first: insulated overlaps, switch crossings, bridges, level crossings, tunnels, tight-radius curves and locations requiring special contact-wire height treatment. The section design can then be developed between these fixed points.
13.7 Catenary System Assessment
A catenary system assessment evaluates both the static geometry and the dynamic pantograph–catenary behaviour. Static acceptance checks whether the constructed system matches the design documents. Dynamic acceptance checks whether the pantograph can collect current safely and reliably at operating speed.
13.7.1 Static Assessment
Static assessment is carried out before normal operation to find installation errors in foundations, mast positions, mast verticality, tensioning devices, cantilevers, droppers and support equipment. The main measured parameters are contact-wire height, system height and stagger. These checks are necessary because small construction errors can create local clearance problems or stiffness discontinuities that later appear as dynamic defects.
13.7.2 Dynamic Assessment
Dynamic assessment is needed because the catenary is loaded by a moving pantograph. Instrumented pantographs and measurement vehicles record contact force, pantograph uplift, contact-wire height, acceleration and arcing. EN 50367 [75] specifies limits for mean contact force, contact-force standard deviation, pantograph uplift and percentage of arcing.
The force between the pantograph and contact wire is the key performance indicator. If the force is too high, mechanical wear increases. If the force is too low, contact can be lost and arcing can occur. A well-performing system gives a regular force pattern along the line, while local defects often appear as sharp peaks at supports, overlaps, switches, bridges, height transitions or other concentrated mass locations.
For Norwegian maintenance assessment, Bane NOR separates high-force and low-force limits. Table 13.5 summarises the main thresholds used in this introductory treatment.
| Check | Application | Limit values | Action trigger |
|---|---|---|---|
| Maximum contact force, \(F_\text{max}\) | System 20 and System 25, \(v>160\) km/h | Maintenance: 150 N; critical: 200 N | Speed reduction at 230 N |
| Maximum contact force, \(F_\text{max}\) | Other systems | Maintenance: 120 N; critical: 150 N | Speed reduction at 180 N |
| Minimum contact force, \(F_\text{min}\) | All systems | Maintenance: at least 20 N; critical: at least 10 N | Speed reduction if \(F_\text{min}\leq 0\) |
The values give the scale of the checks, but current regulations and the line's own documentation must always be used before making an operational decision.
If the mean contact force is denoted \(F_m\) and the standard deviation is \(\delta\), the range \(F_m \pm 3\delta\) is a useful acceptance interpretation. The lower bound must remain positive to avoid contact loss and arcing, while the upper bound must remain low enough to avoid excessive mechanical wear. The standard deviation also makes it possible to compare catenary designs or maintenance states under similar speed and pantograph conditions.
13.7.3 Wear Mechanisms and Monitoring
Two opposing wear mechanisms act simultaneously:
- Mechanical wear (high force)
-
High contact force increases friction between the contact strip (carbon) and the contact wire (copper), generating heat and accelerating material loss. Carbon contact strips have favourable solid-lubricating properties, but electrical current and local heating are wear mechanisms rather than a beneficial melting process under normal operation.
- Electrical wear, arcing (low force)
-
When contact is lost, the current continues to flow as an arc. The arc generates extreme localised temperatures that ablate both the contact strip copper backing and the contact wire copper surface. Arcing is therefore far more damaging per unit time than mechanical wear.
Good catenary design aims for a moderate, steady contact force with minimal variance, avoiding both excessive friction and arcing. The stagger prevents the concentration of all wear at one location on the contact strip.
The same principle appears in the maintenance requirement for contact-wire wear: the remaining contact-wire cross-section must not be less than 80 % of the new wire cross-section [37]. This limit is electrical as well as mechanical, because a worn wire has less current-carrying area and less residual tensile capacity.
Figure 13.15 shows the kind of surface damage associated with unstable current collection and arcing.
![Arc-related wear on contact strip and contact wire [136].](../../assets/chapters/ch13/original/figures_lecture_crops/fig_arc_related_wear_surfaces_lecture.jpg)
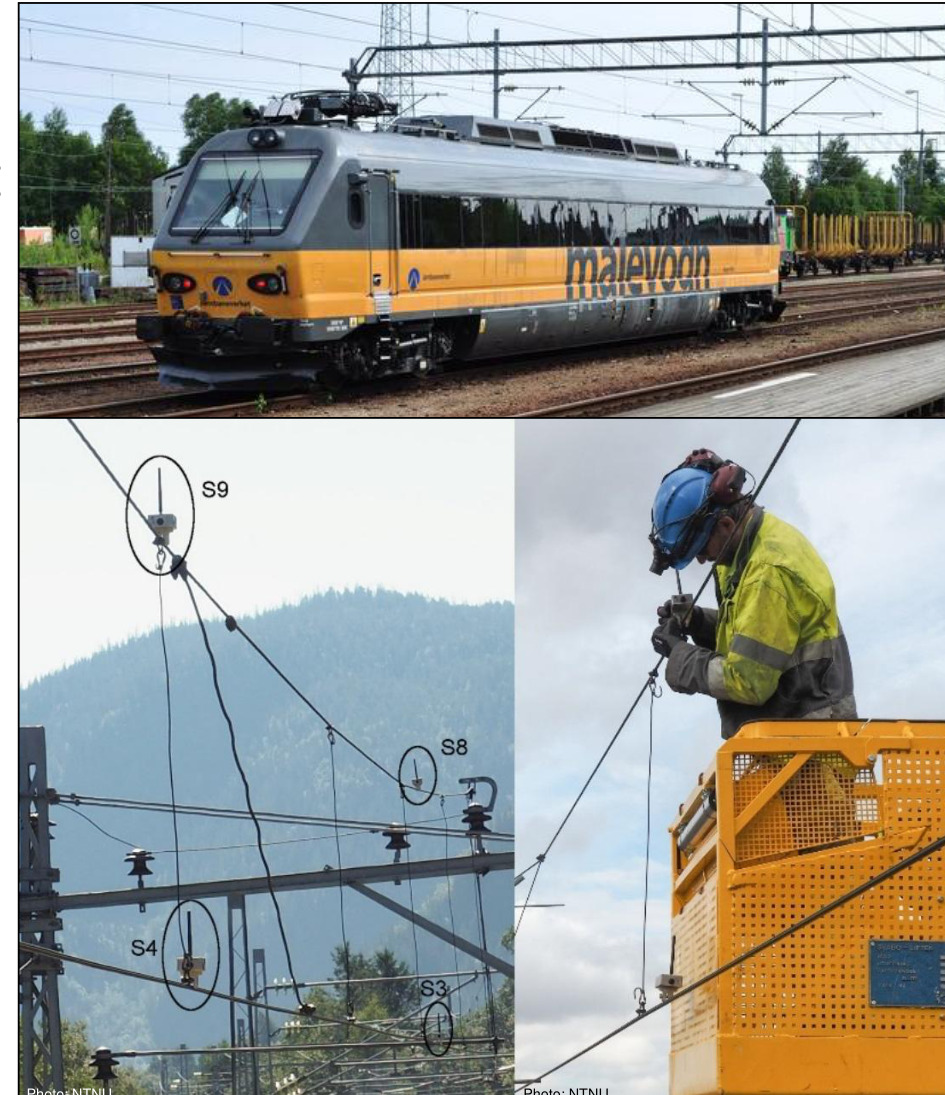
Catenary infrastructure is assessed by the measurement routes shown in Figure 13.16: dedicated measuring vehicles record parameters at operational speed, including contact force, wire height, stagger, wire cross-section (by laser or eddy current), and percentage of arcing, while local accelerometer networks mounted on catenary structures support continuous structural health monitoring and predictive maintenance.
13.8 Chapter Summary
System function. The catenary delivers traction power to the moving train while maintaining reliable sliding contact between the pantograph and contact wire. This requires a complete power chain from the national grid or frequency converter through feeders, contact wire, pantograph, train and return-current path. Electrical capacity, insulation, return current and mechanical contact quality must therefore be designed together.
Main components. Messenger wire, contact wire, droppers, cantilevers, masts, tensioning devices and midpoint anchors form one interacting system. Droppers and support points set the vertical profile, cantilevers set the lateral position, and tensioning devices compensate for temperature effects. Contact wire stagger is especially important because it distributes wear across the pantograph strip instead of concentrating it in one line.
Dynamic performance. A pantograph generates an uplift wave in the contact wire, and stable current collection requires the train speed to remain below the relevant wave-propagation speed with sufficient margin. Wire tension, mass per unit length, span length, elasticity and support stiffness therefore influence both the maximum speed and the contact force variation. Poor dynamic compatibility leads to arcing, loss of contact and accelerated wear.
Acceptance checks. Static acceptance verifies installation geometry, contact-wire height, stagger, mast position, tensioning devices and mechanical clearances. Dynamic acceptance measures contact force, uplift, arcing and other response quantities under operating conditions. Current limit values are system-specific, and the line documentation must be used together with the regulation. The combination is necessary because a system can look correct geometrically but still perform poorly when excited by a pantograph at speed.
Special locations. Turnouts, overlaps, bridges, tunnels, neutral sections and height transitions introduce stiffness and geometry changes that can disturb contact quality. These locations require careful coordination of contact-wire position, support layout and pantograph path. Maintenance and monitoring are therefore essential parts of catenary engineering, not just follow-up activities after construction.
Assignments
Assignment 1: Before starting catenary design
The design of a catenary system often begins after most of the railway corridor has already been planned. The overhead line must therefore fit around track geometry, structures, signalling, cables, access constraints and future operating requirements.
Prepare a design-basis checklist for the preliminary catenary design stage. At a minimum, include the following groups of information and explain why each group is needed:
(a) Confirmed track layout, track centre-line coordinates and cross-sections at possible mast or portal locations.
(b) Bridge, tunnel, snow-shed, platform, level-crossing and clearance information.
(c) Signalling layout, track circuits, cable routes, earthing and bonding constraints.
(d) Soil and foundation information at mast, portal and anchor locations.
(e) Selected catenary system, contact-wire height, system height, tension, insulation level, short-circuit level, wind, ice and temperature range.
(f) Switching diagrams, feeder arrangements, nearby power lines, control interfaces and future requirements.
Assignment 2: Pantograph–catenary interaction and wear
The quality of the interaction between pantograph and catenary is central to reliable electric railway operation. The catenary design controls the contact quality, and the same design choices influence wear of both the contact wire and the pantograph contact strip.
(a) Describe which catenary design features and operational parameters influence the quality of contact between pantograph and contact wire. Include wire tension, span length, span sequence, contact-wire height, sag, elasticity, damping, dropper layout, static uplift force, aerodynamic force, train speed and environmental effects.
(b) Describe which parameters influence wear of the contact wire and the pantograph contact strip. Include high contact force, contact loss, arcing, current level, material choice, stagger, span length and train speed.
(c) Use Figure 13.15 and Table 13.5 to explain why both high-force and low-force limits are needed in maintenance assessment.
Assignment 3: Wave propagation speed
A System 25 contact wire (AC-120 Cu, linear mass \(m'_{CW}=1.07\) kg/m) is tensioned to \(H_0=15\) kN.
(a) Calculate the wave propagation speed \(c_p\).
(b) The maximum permitted train speed is 70 % of \(c_p\). Does System 25 support 250 km/h operation?
(c) If the tension were reduced to 10 kN, representative of System 20, what would the maximum train speed be? Comment on the implications for upgrading from System 20 to System 25.
Assignment 4: Catenary design over switches and crossings
Design the catenary over a turnout location using the simplified method in Section 13.6.10. Use the planning basis in Figure 13.13. The turnout is EW 60-1200-1:18.4, the wire is AC-100 copper, and the contact-wire tension is 10.5 kN.
(a) List the ten design steps used to place the two contact wires and their supports.
(b) Draw the required contact wires and cantilevers as lines and mark each pole position.
(c) On the drawing, report the stagger at each support for each wire, the \(x_1\) point where the side-track wire is uplifted 150 mm, the \(x_2\) point where it is uplifted 200 mm, the span length, and the distance from each support pole to the track centre line.
(d) Check whether the selected clamp positions are compatible with the clamp-free zone and with practical cantilever lengths.
(e) Compare the final layout with Figure 13.14 and explain any differences.
Assignment 5: Contact wire height change
Contact-wire height may have to change near low bridges, tunnels, platforms, stations or transitions between different catenary systems. The change must be spread over enough spans to satisfy the height-gradient requirements in Equations 13.2–13.3. Use the template in Figure 13.17 to present the span types, span lengths, gradients and wire heights.
![Template for contact-wire height-change design [133].](../../assets/chapters/ch13/original/figures_lecture_crops/fig_assignment_height_change_template.png)
(a) System 20 A has a nominal contact-wire height of 5.60 m. A low bridge requires the height to be reduced to 5.05 m. The span length is fixed at 50 m in the affected section. Design the lowering from the standard height to the bridge height. Specify the number of spans, the gradient in each span and the contact-wire height at each pole location.
(b) An upgraded line connects a section equipped with System 25 to a section equipped with System 20 A. For this exercise, take the System 25 contact-wire height as 5.10 m and the System 20 A height as 5.60 m, unless project documentation gives other values. For a train speed of 200 km/h and a span length of 60 m, design the height transition and list the same output quantities as in part (a).
(c) Explain where the strictest gradients occur and why sudden height changes are dangerous for pantograph–catenary interaction.
Assignment 6: 15 kV 16.7 Hz versus 25 kV 50 Hz
Compare the Norwegian 15 kV 16.7 Hz AC system, historically written as \(16\tfrac{2}{3}\,\mathrm{Hz}\), with the 25 kV 50 Hz AC system used on many new high-speed lines. For each item below, state which system has the more favourable value and briefly explain the engineering consequence:
(a) Transmission efficiency and resistive losses per kilometre of catenary.
(b) Conductor cross-section required for a given power level.
(c) Electromagnetic interference with signalling and telecommunications.
(d) Compatibility with the existing Norwegian railway network.
(e) Installation cost and complexity for a new high-speed line in Norway.
(f) For a 6 MW train, estimate the line current at 15 kV and 25 kV. If the equivalent feeder resistance is \(0.08\,\Omega/\mathrm{km}\), compare the resistive loss per kilometre using \(P_\mathrm{loss}=I^2R\) and explain why voltage level matters for long high-speed sections.