Railway Noise and Vibration
Railway transportation is one of the most energy-efficient and environmentally friendly forms of land transport. However, it is also a significant source of noise and vibration for people living and working near rail lines. As rail networks expand and train speeds increase, managing the acoustic and vibratory impact of railways has become a central challenge in both infrastructure planning and rolling stock design [151, 65].
This chapter covers the principal sources of railway noise, the mechanisms by which vibration propagates from the track into the ground and into adjacent buildings, the measurement methods and regulatory limits used to quantify and control noise exposure, and the mitigation measures available to the track engineer, infrastructure manager, and vehicle designer.
10.1 Introduction
Noise from railways affects the health and quality of life of large numbers of people. Epidemiological studies [167] have linked long-term exposure to railway noise with increased risk of:
-
Sleep disturbance and sleep deprivation (from pass-by events at night).
-
Cardiovascular disease (elevated blood pressure and risk of myocardial infarction with nighttime \(L_{night} > 50\) dB(A)).
-
Annoyance and reduced cognitive performance in children, particularly for schools adjacent to busy lines.
Vibration from railways is a separate but related problem. Ground-borne vibration can cause:
-
Physical discomfort to building occupants (perceptible vibration at frequencies 1–80 Hz).
-
Damage to sensitive equipment such as electron microscopes, lithography machines, and laboratory balances.
-
Structural damage to historic buildings with inadequate foundations.
-
Re-radiated noise ("rumble") in buildings, where vibration of walls, floors and ceilings converts to low-frequency airborne sound.
Norwegian railway projects are assessed under several overlapping noise regimes: planning guidance for new land use and new infrastructure, action limits for existing sources, and European requirements for strategic noise mapping. The important practical point is to keep these contexts separate rather than treating one limit value as a universal railway-noise requirement [118, 125, 91].
10.2 Sources of Railway Noise
Railway noise can be divided into several distinct source types based on the physical mechanism of sound generation. The dominant source changes with speed: traction noise is important at low speed and standstill, rolling noise dominates at ordinary main-line speeds, and aerodynamic noise becomes increasingly important on high-speed lines.
10.2.1 Rolling Noise
Rolling noise is the dominant noise source at speeds above approximately 50–60 km/h for conventional diesel and electric trains, and above about 80 km/h for freight trains. It arises from the combined roughness of the wheel and rail surfaces [151]. The contact mechanics behind this excitation are introduced in Chapter 8, while corrugation and roughness as track defects are treated in Chapter 15.
As the wheel rolls over the rail, micro-scale surface irregularities on both the wheel tread and the rail running surface excite vibrations in the wheel and rail. These vibrating surfaces radiate sound to the surrounding air. The sound level increases approximately as \(30\log_{10}(v/v_0)\), i.e., by about 9 dB for each doubling of speed.
Worked example.
If the speed of a train increases from 120 to 160 km/h, the rolling-noise increase is
This is a large change acoustically: a few decibels can decide whether a mitigation measure is needed.
The key parameters governing rolling noise are:
-
Wheel and rail roughness: measured as surface height spectra \(L_r(\lambda)\) over wavelengths \(\lambda\) of 3–1000 mm.
-
Contact filter: the contact patch acts as a spatial filter, averaging roughness over its dimensions and attenuating contributions at wavelengths shorter than the contact patch length.
-
Structural dynamics: the wheel's resonances (typically 800–5000 Hz for the major radiating modes) and the rail's pinned–pinned resonance (typically 800–1200 Hz) amplify roughness excitation near these frequencies [151].
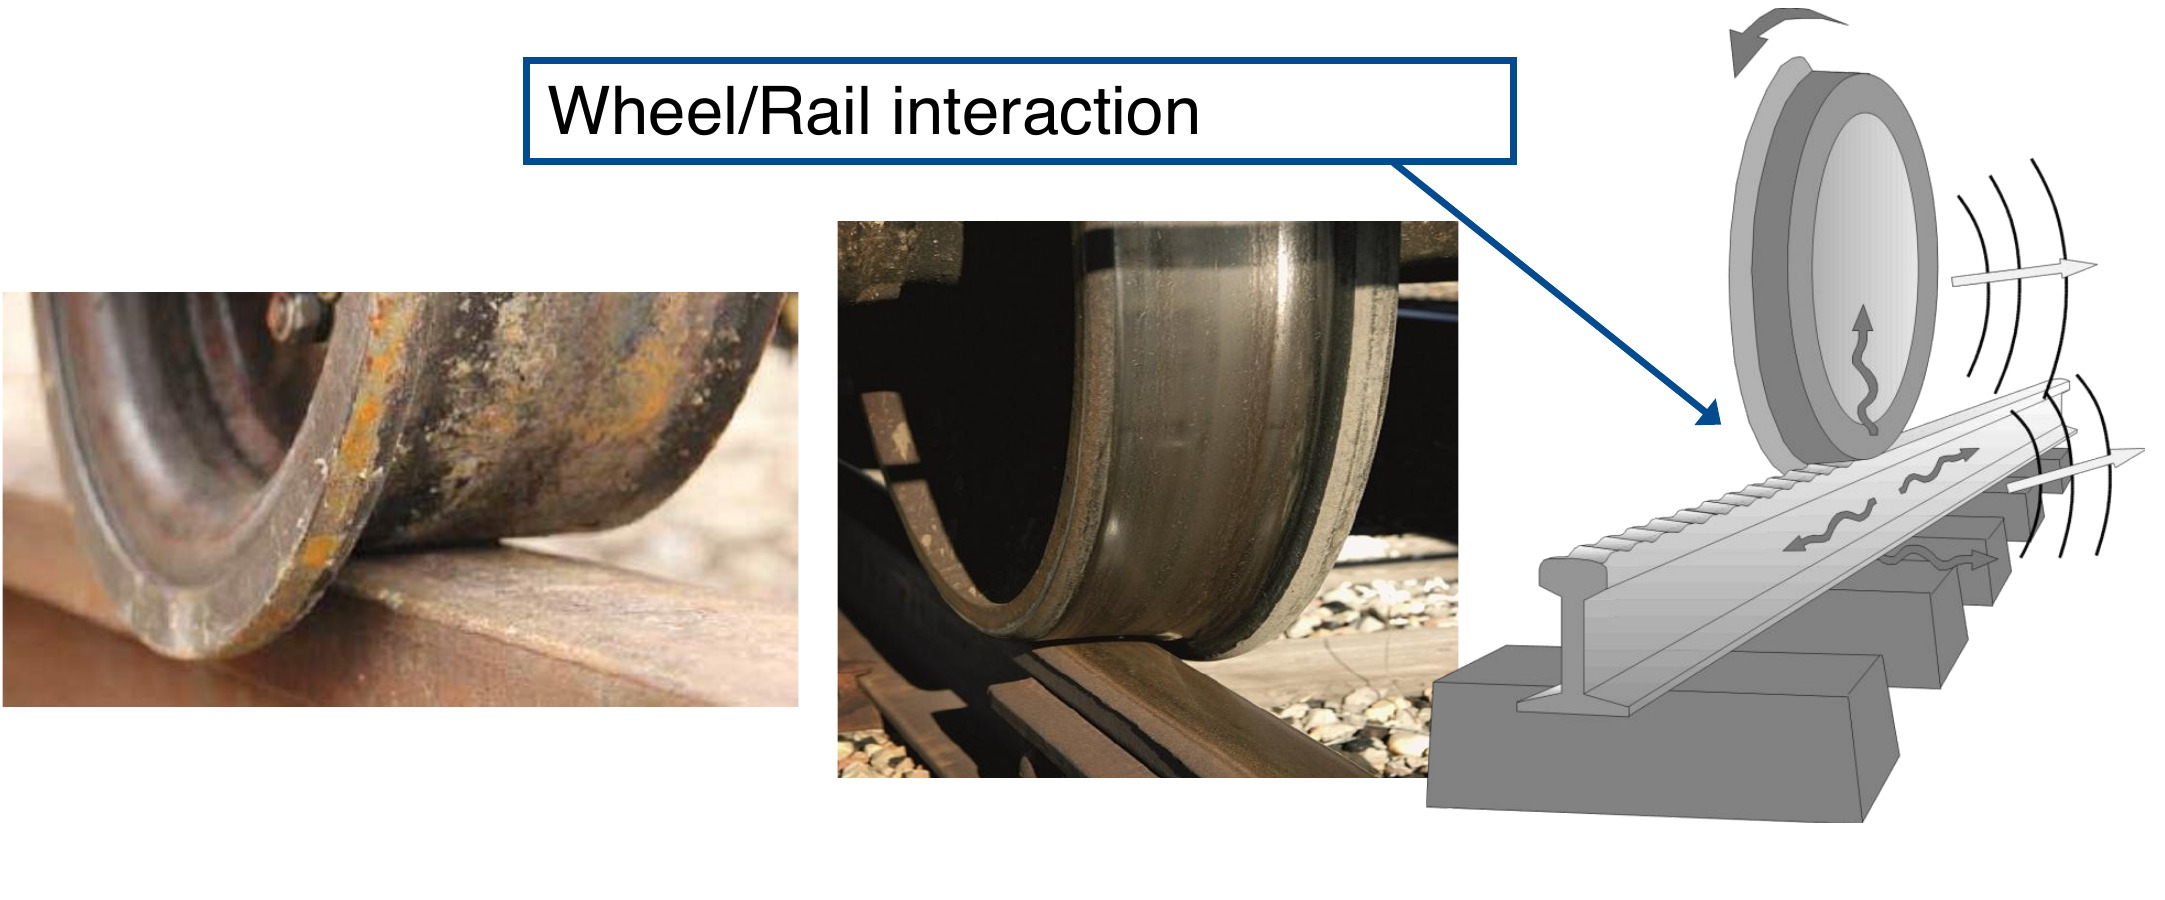
The practical mechanism is the wheel–rail contact itself: surface condition, contact dynamics, and structural vibration combine to determine how much sound is radiated. Figure 10.1 illustrates this interaction using examples of wheel surface condition and a simplified radiation sketch.
10.2.2 Traction Noise
Traction noise is generated by the mechanical and electrical systems of the vehicle: diesel engines, cooling fans, gear boxes, electric motors, compressors, and auxiliary equipment. It dominates at low speeds (below 50–80 km/h) and at standstill. Unlike rolling noise, traction noise levels are nearly independent of speed for a given operating mode.
Key traction noise sources include:
-
Diesel engines: a broadband noise source, typically 90–100 dB(A) at 7.5 m from modern high-power diesel locomotives.
-
Cooling fans: tonal components at blade-passing frequency and harmonics; can be dominant at idle.
-
Electric traction systems: inverter switching noise at frequencies related to the switching frequency (typically 300–3000 Hz); increasingly relevant for EMU fleets.
-
Compressors and auxiliary equipment: significant at stations and during dwell.
Modern traction systems (permanent magnet motors, high-switching-frequency inverters, enclosed gear boxes) have substantially reduced traction noise over the past two decades, so that rolling noise is now the dominant source for most modern electric multiple units (EMUs) above 60–80 km/h [151, 65].
10.2.3 Aerodynamic Noise
At high speeds (\(v > 200\) km/h) aerodynamic noise becomes increasingly important and eventually dominates the total noise level. The main aerodynamic noise sources are:
-
Bogies and undercarriage: turbulent flow around the bogie cavity is the largest source on most high-speed trains.
-
Pantograph: a significant discrete source; pantograph-related noise can exceed rolling noise at speeds above 280 km/h.
-
Inter-car gaps: flow separation and cavity resonances in the gaps between coaches.
-
Nose and tail: pressure disturbances propagate as travelling waves along the train length.
Aerodynamic noise grows approximately as \(60\log_{10}(v/v_0)\), i.e. by about 18 dB per doubling of speed, much faster than rolling noise. At 300 km/h, each 10 km/h increase in speed adds approximately 0.9 dB(A). Equivalently, each 25 km/h increase adds approximately 2 dB(A) [151].
10.2.4 Impact Noise
Impact noise arises from discontinuities in the running surface:
-
Rail joints and insulated joints: a wheel crossing a gap generates a sharp impulsive force. Welded track (CWR) has largely eliminated this source on main lines, but insulated block joints in signalling systems remain a problem.
-
Switches and crossings: the wheel transitions from the running rail onto the crossing frog, creating both a geometric gap (crossing nose) and a change in rail head height. The resulting impact force radiates as a loud impulse, typically 5–10 dB above the rolling noise level for the same train speed.
-
Wheel flats: a flat spot on the wheel tread, caused by wheel locking during braking, generates a repetitive impact at a frequency equal to the train speed divided by the wheel circumference. Even a 50 mm flat is clearly audible and generates excessive dynamic forces (see Chapter 8).
-
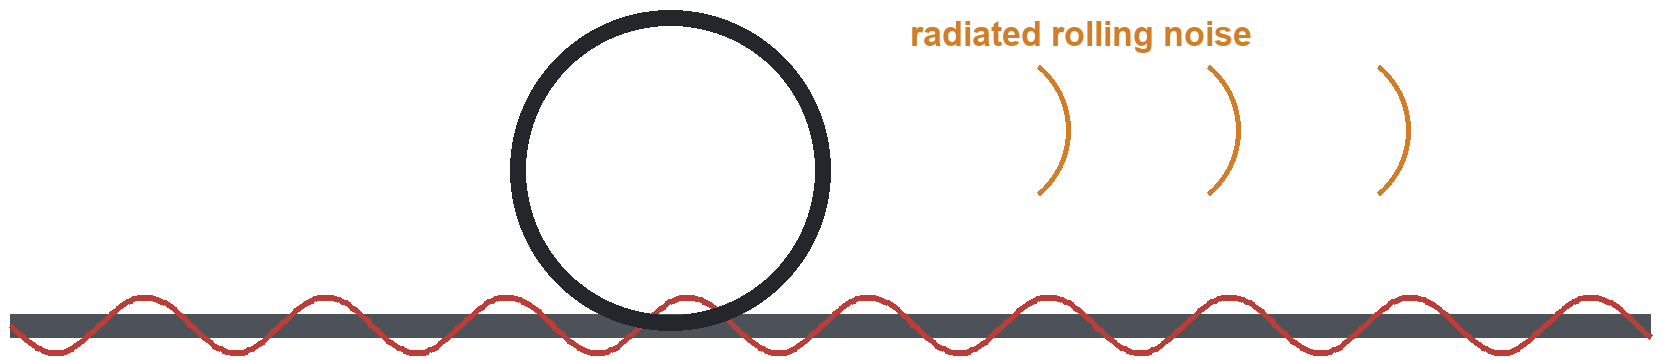
Rail corrugation: short-pitch (20–80 mm) periodic rail roughness generates a strong tonal noise component at the corrugation frequency \(f = v / \lambda_c\); for \(\lambda_c = 30\) mm and \(v = 100\) km/h, \(f \approx 925\) Hz. Because corrugation is periodic (Figure 10.2), residents often describe the resulting tonal noise as a "singing" or "howling" sound, and the same repeated excitation also raises dynamic wheel–rail forces and accelerates track degradation [101, 102].
10.2.5 Brake Squeal and Curve Squeal
Brake squeal occurs during braking with cast-iron block brakes. The cast-iron brake block contacts the wheel tread and creates a rough surface finish on the tread, increasing the roughness that drives rolling noise. Modern composite brake blocks (K-blocks) have been developed as a direct replacement that does not increase tread roughness and significantly reduces rolling noise, particularly from freight wagons at night. UIC's freight-noise work links the homologation and use of K- and LL-blocks directly to noise reduction in freight traffic [110].
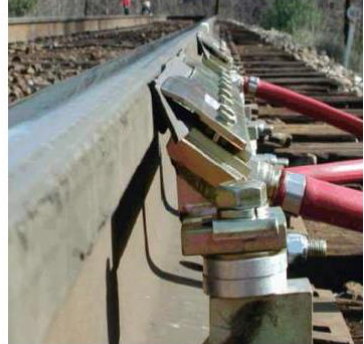
Curve squeal is a strong tonal noise, typically in the 500–4000 Hz range, generated by the lateral creep of the wheel flange and tread in tight curves. It arises from a self-excited instability (stick-slip) in the lateral creep force. Curve squeal can reach 115–120 dB(A) pass-by level and is one of the most annoying railway noises for trackside residents. It is predominantly a problem on curves with radius \(R < 300\) m [151, 4]. Practical mitigation therefore focuses on controlling the wheel–rail friction condition in the curve, using friction modifiers, rail lubricators, or water spray systems.
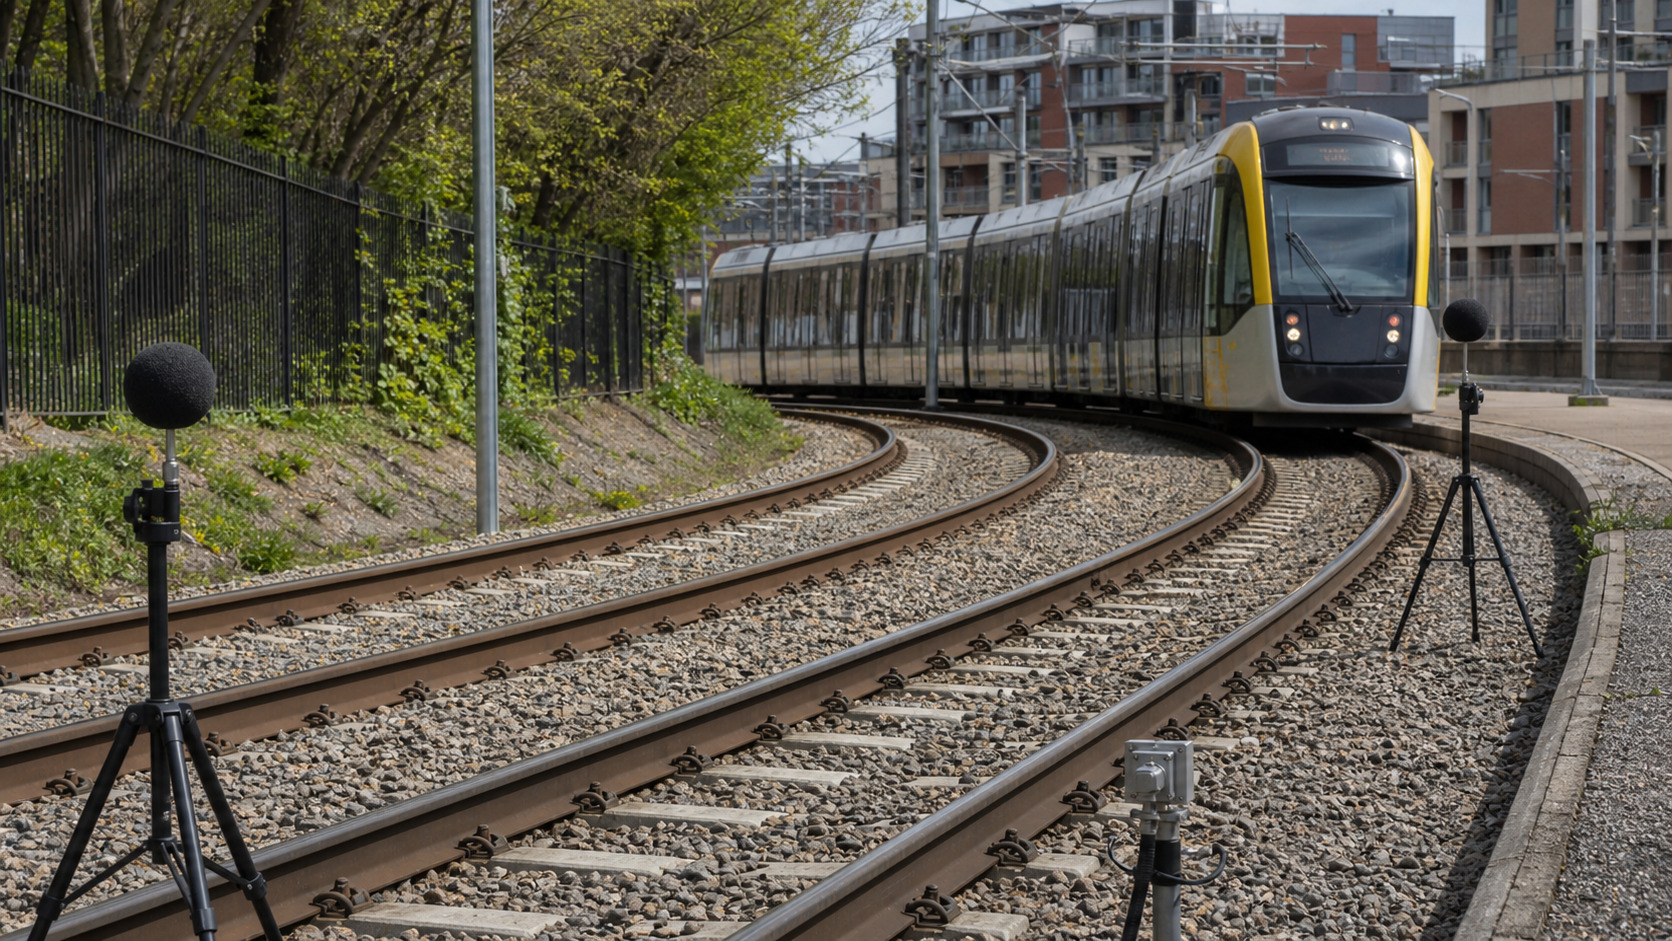
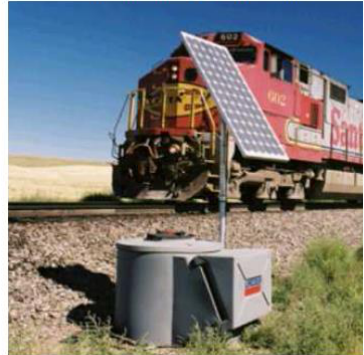
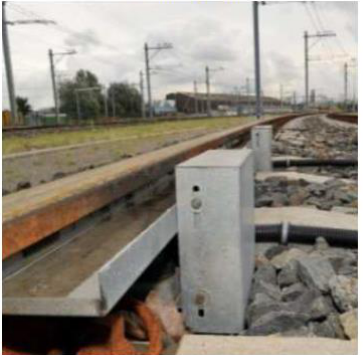
In practice, curve-squeal mitigation is usually a trackside maintenance and friction-control problem. Figure 10.3 gives examples of field diagnosis and equipment used to manage the wheel–rail friction condition in tight curves.
 (a) Rail-side friction modifier
 (b) Curve-squeal measurement setup
 (c) Trackside supply unit
 (d) Compact trackside applicator
10.3 Ground-Borne Vibration
Ground-borne vibration is treated separately from airborne noise because the transmission path, frequency range, and mitigation measures are different. The following subsection traces the vibration from the wheel–rail contact into the ground and nearby buildings.
10.3.1 Generation Mechanism
Ground-borne vibration is generated by the dynamic wheel–rail forces described in Chapter 8. The oscillating contact forces propagate downward through the rail and fastening system into the sleepers and ballast (or slab), and from there into the ground as elastic waves. The dominant frequency range is approximately 4–200 Hz [151].
The main vibration excitation mechanisms are:
-
Quasi-static deflection: the ground deflects under the passing train weight, creating a slowly moving elastic bowl that is felt as a low-frequency (\(< 10\) Hz) disturbance in the near field.
-
Dynamic roughness excitation: wheel and rail roughness excite dynamic forces at frequencies from about 20 to 2000 Hz. Ground-borne vibration in the 20–200 Hz range from this source propagates as body waves (P and S waves) and surface Rayleigh waves.
-
Parametric excitation: the periodic variation in track stiffness between mid-sleeper-bay and directly above a sleeper generates an excitation at the sleeper-passing frequency \(f_{sp} = v / d_s\) (where \(d_s\) is the sleeper spacing, typically 0.6 m).
10.3.2 Wave Propagation in the Ground
Once energy enters the ground, it propagates as:
-
P-waves (compression waves): propagate in all directions at the P-wave velocity \(c_P = \sqrt{(K + 4G/3)/\rho}\), typically 300–2000 m/s in soil and rock.
-
S-waves (shear waves): propagate at \(c_S = \sqrt{G/\rho}\), typically 100–600 m/s. More efficient at transmitting vibration in the critical 4–80 Hz range than P-waves.
-
Rayleigh waves: surface waves that carry most of the vibration energy to distances beyond about 5 m from the track. They decay as \(r^{-1/2}\) with distance (geometric spreading), whereas body waves decay as \(r^{-1}\) or faster [129].
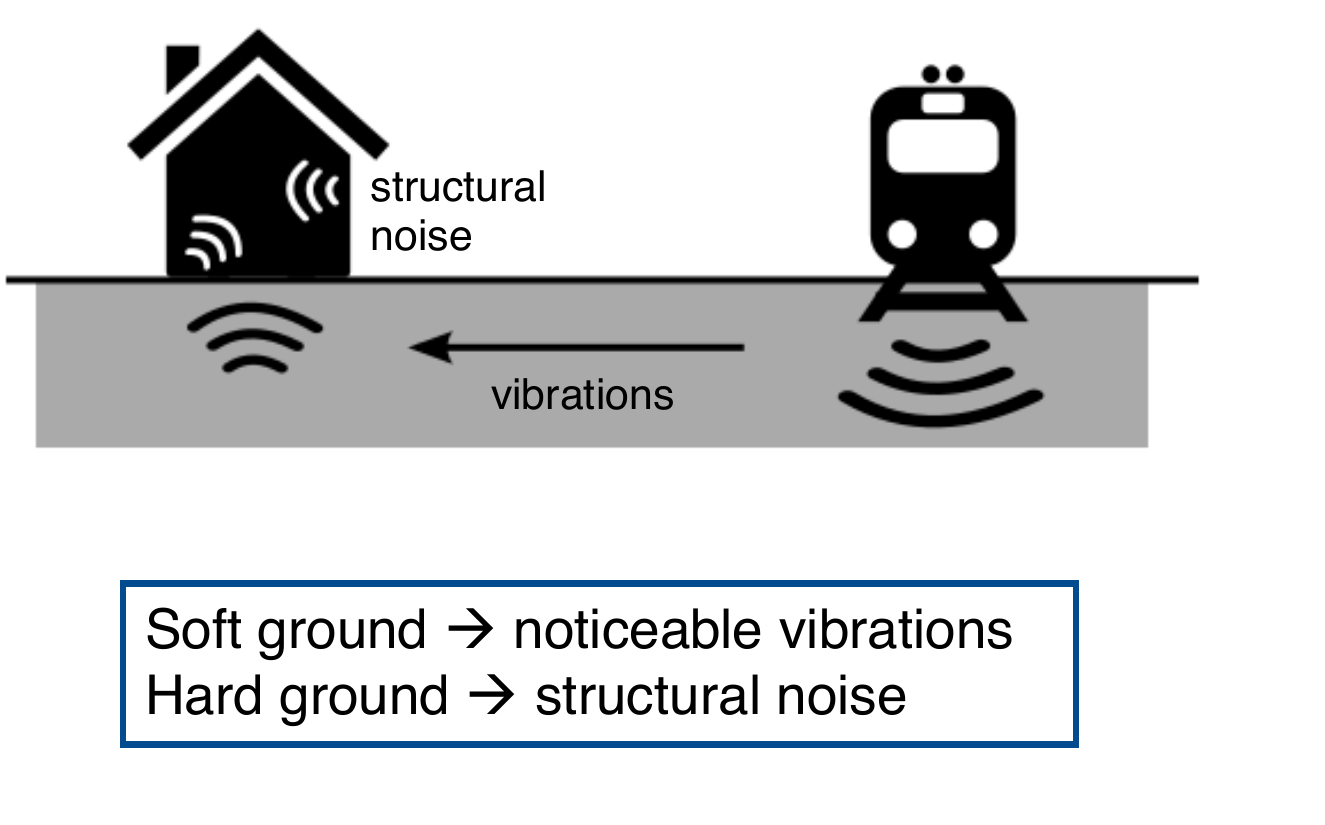
The relative importance of these wave types changes with soil layering, distance, and frequency. A useful practical distinction is that soft ground is often associated with noticeable vibration, while hard ground can transmit vibration efficiently into buildings where it is re-radiated as structural noise. Figure 10.4 illustrates this vibration-to-structural-noise pathway.
10.3.3 Building Response and Re-radiated Noise
When ground vibration reaches a building foundation, it is transmitted through the structural system (columns, slabs, walls) to the floors and ceilings. The floor and ceiling vibration radiates as low-frequency airborne sound, known as structure-borne noise or re-radiated noise. This manifests as a low-frequency "rumble" inside the building that is difficult to treat with conventional sound insulation, because the noise arrives via the structure rather than through the facade.
The frequency range of re-radiated noise is typically 16–250 Hz. Assessment uses both vibration metrics (velocity level \(L_v\) in dB re \(10^{-9}\,\mathrm{m\,s^{-1}}\) or acceleration level \(L_a\) in dB re \(10^{-6}\,\mathrm{m\,s^{-2}}\)) and acoustic metrics (sound pressure level in dB(A) or dB(C) for very low frequencies) [151, 167].
10.4 Noise Measurement and Regulatory Limits
Noise assessment requires both a physical quantity and a regulatory context. This section therefore introduces the acoustic indicators before linking them to Norwegian limit values and mitigation decisions.
10.4.1 Acoustic Quantities
The fundamental quantity for noise assessment is the A-weighted sound pressure level \(L_A\), calculated as \(L_A = 10 \log_{10}(p_A^2/p_\text{ref}^2)\) in dB(A), where \(p_A\) is the A-weighted root-mean-square pressure and \(p_\text{ref} = 20\,\mu\mathrm{Pa}\) is the reference sound pressure. The A-weighting filter approximates the frequency sensitivity of the human ear at moderate sound levels, attenuating very low (\(< 100\) Hz) and very high (\(> 8000\) Hz) frequencies.
For railway noise assessment, the most important acoustic indicators are listed below. This table defines what each indicator measures; the Norwegian planning and action values are summarised separately in Table 10.1.
| Indicator | Use in railway-noise assessment |
|---|---|
| \(L_{Aeq,T}\) | Equivalent continuous A-weighted level over a time period \(T\). |
| \(L_{Amax}\) | Maximum A-weighted pass-by level; used in sleep-disturbance assessment. For Norwegian railway planning, the statistical form \(L_{5AF}\) is used. |
| \(L_{den}\) | Day–evening–night equivalent level for mapping and planning. |
| \(L_{night}\) | Nighttime equivalent level, 23:00–07:00; linked to sleep disturbance. |
The notation \(L_{5AF}\) is compact but important. The subscript 5 means the A-weighted maximum level exceeded by 5% of the relevant noise events, such as individual train pass-bys. The letter A denotes A-weighting, and F denotes the "Fast" 125 ms time weighting. It is therefore a statistical maximum level, not necessarily the single loudest train event in the period [118].
The day–evening–night indicator is an energy average with penalties added to evening and nighttime exposure:
Here \(L_d\), \(L_e\) and \(L_n\) are the daytime (07:00–19:00), evening (19:00–23:00) and nighttime (23:00–07:00) levels. The evening and nighttime penalties are 5 dB and 10 dB respectively.
Worked example.
Suppose \(L_d = 60\) dB(A), \(L_e = 55\) dB(A) and \(L_n = 50\) dB(A). After the evening and night penalties, all three energy terms become equivalent to 60 dB(A):
The example shows why nighttime railway noise is important even when the measured nighttime equivalent level is lower than the daytime level.
10.4.2 Norwegian Regulatory Framework
Norwegian railway-noise assessment should keep three regulatory contexts separate. Table 10.1 summarises the main values used for planning, zoning and existing-activity follow-up.
| Context | Indicator | Railway value | Use in assessment |
|---|---|---|---|
| T-1442 planning value | \(L_{den}\) | \(\leq 58\) dB | Outside windows in rooms with noise-sensitive use and on the quiet part of outdoor amenity areas. |
| T-1442 night maximum | \(L_{5AF}\) | \(\leq 75\) dB | Outside bedroom windows for night periods with more than ten railway events. |
| T-1442 yellow zone | \(L_{den}\) or \(L_{5AF}\) | \(>58\) dB or \(>75\) dB | Assessment zone where noise-sensitive development requires careful planning and mitigation. |
| T-1442 red zone | \(L_{den}\) or \(L_{5AF}\) | \(>68\) dB or \(>90\) dB | Zone generally unsuitable for new noise-sensitive use unless justified in priority development areas. |
| Pollution Regulations Chapter 5 | \(L_{pAeq,24h}\) indoors | \(>42\) dB | Action threshold for existing activities and existing buildings. |
T-1442 values are planning-guideline values. Binding project requirements are set through plans, permits, building regulations, and project-specific conditions.
The table should be read together with the regulatory context:
-
T-1442/2021: the Norwegian government's noise guidelines for land-use planning and new noisy infrastructure. For railway noise, the main planning indicator is \(L_{den}\), with a separate nighttime maximum-level indicator \(L_{5AF}\) outside bedrooms when there are more than ten events per night [118].
-
Pollution Control Regulations.\ Chapter 5 of Forurensningsforskriften governs mapping, action plans, and thresholds for existing activities. Its central action threshold is an indoor \(L_{pAeq,24h}\) value, not the outdoor railway planning value in T-1442 [125].
-
EU Directive 2002/49/EC: requires strategic noise mapping and action plans for major railways and agglomerations [91, 70].
The practical review point is that \(L_{night}\), \(L_{5AF}\), and indoor \(L_{pAeq,24h}\) answer different questions. They should not be substituted for one another without checking the applicable regulation or project condition.
10.4.3 Vibration Measurement
Ground-borne vibration is quantified by the vibration velocity level \(L_v\) (in dB re \(10^{-9}\,\mathrm{m\,s^{-1}}\)) measured at octave or one-third octave bands. The most widely used assessment standard is ISO 14837-1, which defines measurement procedures for railway-induced vibration. The Norwegian standard NS 8176 specifies vibration classes for dwellings using the statistical maximum weighted velocity \(v_{w,95}\):
-
Class A: \(v_{w,95} \leq 0.1\) mm/s.
-
Class B: \(v_{w,95} \leq 0.2\) mm/s.
-
Class C: \(v_{w,95} \leq 0.3\) mm/s.
-
Class D: \(v_{w,95} \leq 0.6\) mm/s.
Classes A and B represent stricter comfort levels that may be used where a high vibration standard is required, while Class D is a less demanding class for cases where Class C is not practical. Class C is commonly used as a planning target for new land-based transport infrastructure near dwellings, but the exact requirement must be checked for the specific project [109, 149].
10.5 Mitigation Measures
Mitigation of railway noise and vibration can be applied at three levels: at the source (vehicle and track), along the propagation path, and at the receiver (building facade). Source-based measures are generally most cost-effective.
10.5.1 Rail Grinding for Rolling Noise
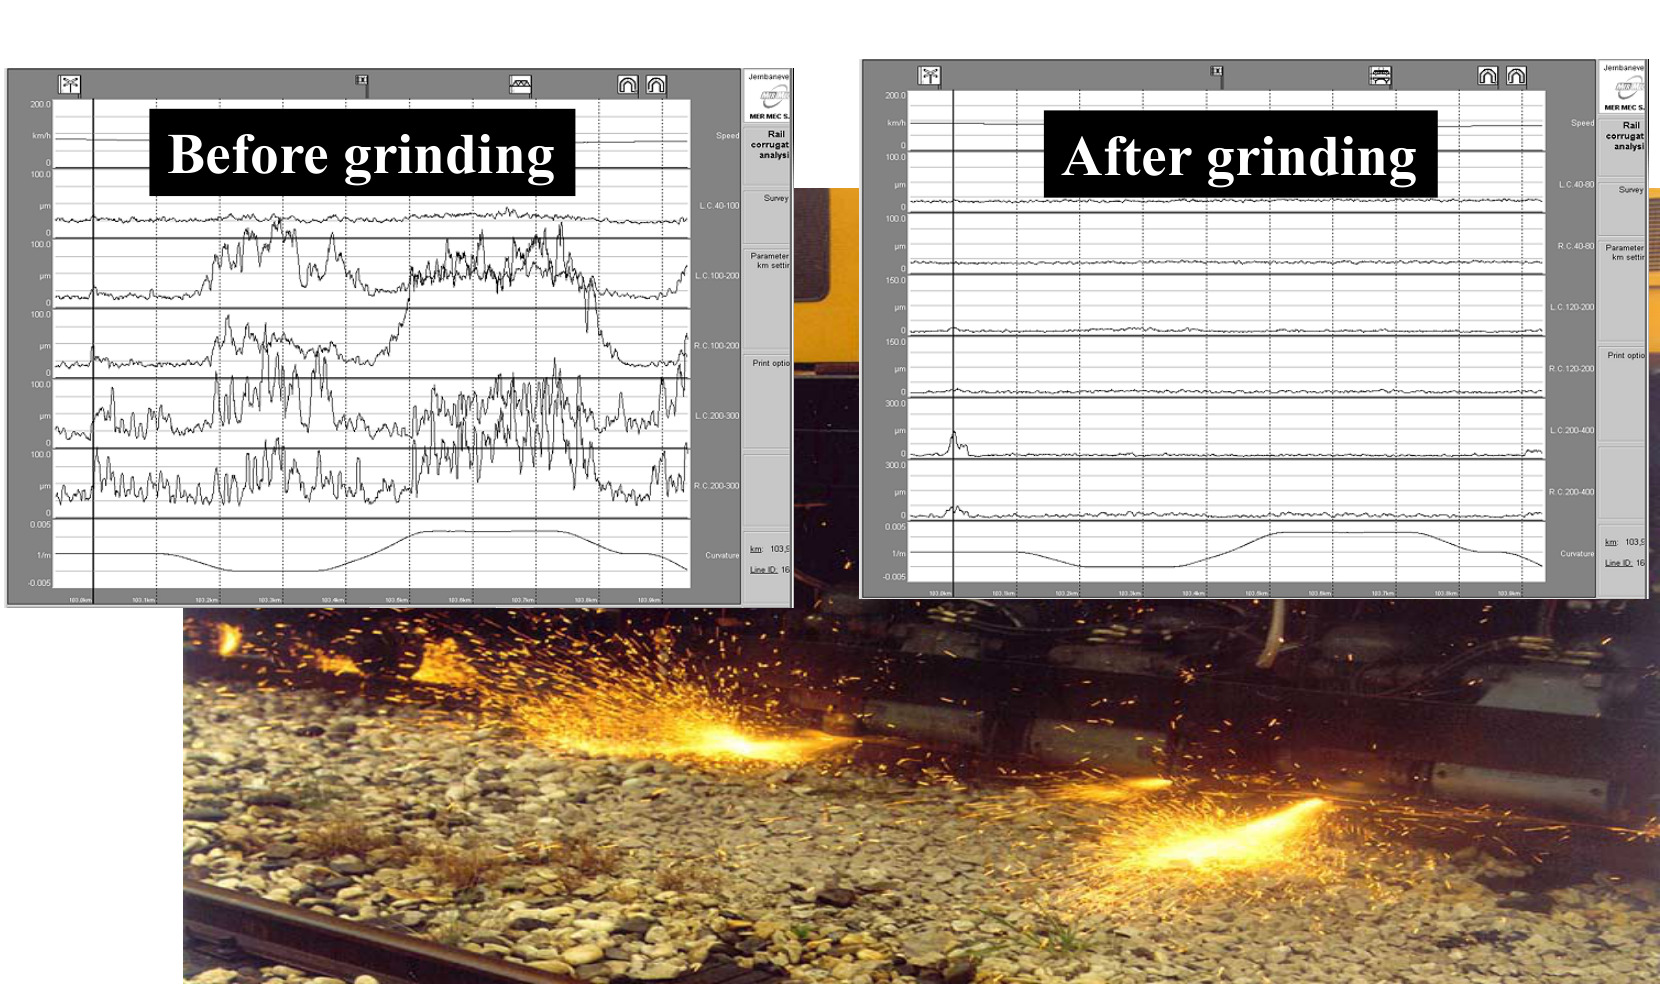
Rail grinding (described in Chapter 16) removes surface material to restore a smooth rail profile, reducing both rail corrugation and roughness. In Bane NOR practice, rail grinding is not specified as one universal calendar interval: the rail-maintenance rules treat grinding, milling, or planing as condition-triggered actions to be carried out no later than the permitted wave-depth limit for rail corrugation and waves is reached. A separate gross-tonnage rule applies to weld finishing: in trafficked track, final grinding must be performed as soon as possible and before more than 30 000 gross tonnes have passed over the weld [13, 11]. The noise mechanism is the reduction of surface roughness and corrugation that excite wheel and rail vibration, as illustrated in Figure 10.5. Rail grinding is therefore one of the most cost-effective rolling-noise mitigation measures available to the infrastructure manager [101, 124].
10.5.2 Resilient Components
Resilient track components reduce noise and vibration by changing the vertical stiffness and damping between the rail, sleeper, ballast, slab and tunnel invert. The component must be selected together with the rest of the support system: making one layer softer can reduce vibration transmission, but excessive total deflection can create geometry, stability or resonance problems.
Rail pads and elastic fastenings. Standard elastic rail fastenings (e.g. Pandrol, Vossloh) use a rail pad to control rail-seat stiffness, peak contact pressure and electrical insulation, as illustrated in Figure 10.6. For noise and vibration mitigation, softer rail pads or under-rail pads are used to increase rail decay rate and attenuate vibration transmission from rail to sleeper. Typical soft rail-pad stiffness values are about 5–30 kN/mm, compared with much stiffer standard pads in ordinary track. The insertion loss is commonly 5–15 dB in the 200–1000 Hz octave bands, depending on the complete fastening and support system [151, 65].
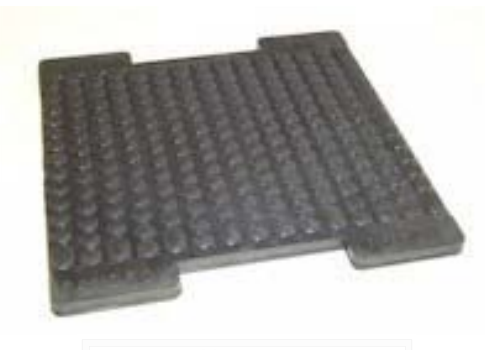
(a) Rail pad
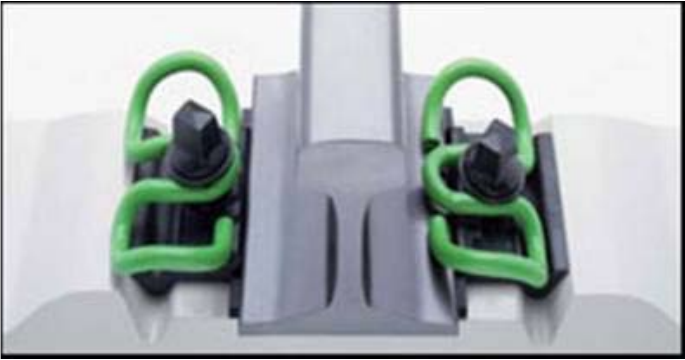
(b) Elastic rail fastening
Under-sleeper pads (USPs). Under-sleeper pads are resilient elastomeric layers bonded to the underside of concrete sleepers, as shown in Figure 10.7. Bane NOR's technical regulations list concrete sleepers supplied with under-sleeper pads (svillematter) and specify their static stiffness classes [47, 45]. USPs act locally at each sleeper–ballast contact. They reduce the dynamic stiffness of the ballast–sleeper interface, reduce impact forces at joints and crossings, and can reduce ground-borne vibration above the sleeper–ballast resonance. They also improve ballast particle behaviour by increasing contact area and reducing local crushing.
Under-ballast mats (UBMs). Under-ballast mats are continuous resilient sheets placed beneath the entire ballast layer, normally on hard subgrade, a tunnel invert, bridge deck or prepared formation. Unlike USPs, which work at discrete sleeper locations, a UBM isolates the ballast bed as a whole. This can improve ground-borne vibration isolation while retaining conventional sleepers and tampable ballast. Very soft mats may reduce track stability and settlement resistance, so stiffness, ballast depth, drainage and maintenance access must be checked together. Bane NOR's technical regulations also state that UBMs should not be combined with USPs because the combined elastic layers can produce adverse resonance and excessive deflection [10, 151, 124].
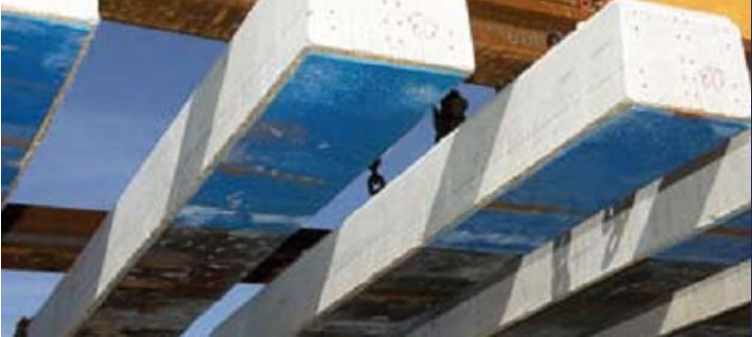
(a) Under-sleeper pads
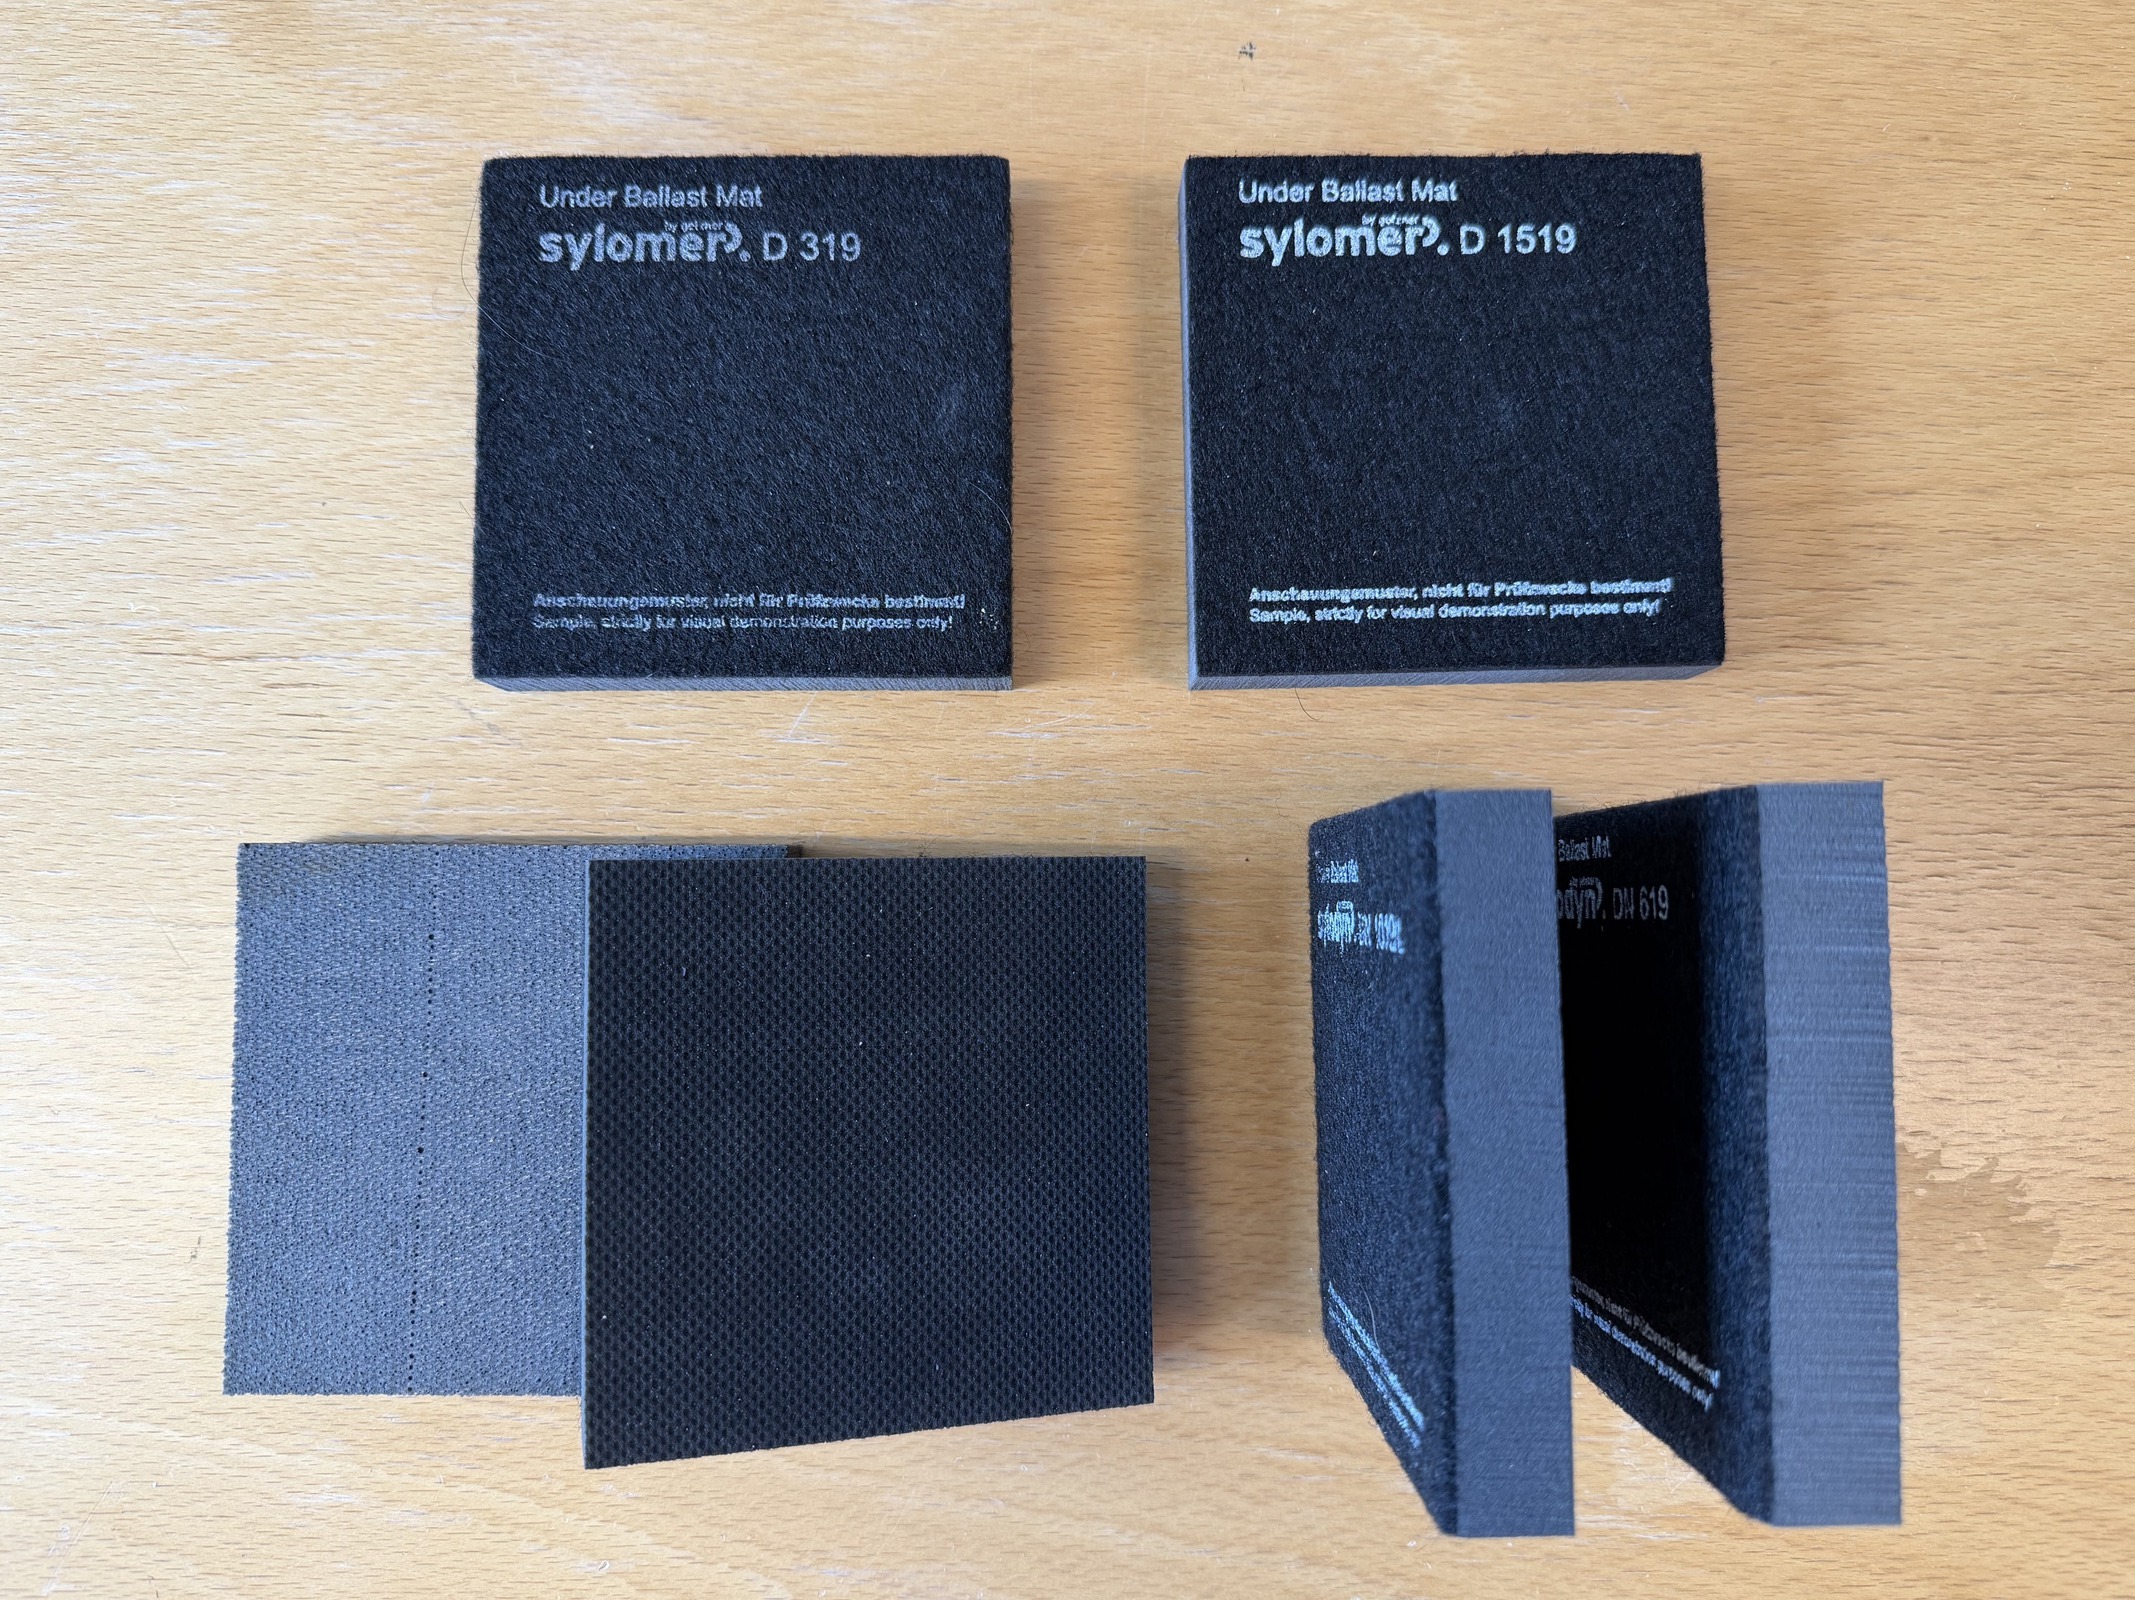
(b) Under-ballast mat samples
Floating slab track (FST). In slab track, tunnels, and other locations without conventional sleeper–ballast contact, resilience is normally provided by under-slab mats, booted sleepers or blocks, or floating slabs [65, 124]. Floating slab track is the most effective vibration isolation measure for railways in tunnels and urban environments. The concrete slab is supported on resilient isolators (springs or elastomeric mounts) with natural frequency typically 7–15 Hz. Above twice the natural frequency the isolation increases at approximately 12 dB per octave. Insertion losses of 20–40 dB are achievable above 50 Hz, making FST the standard solution for underground railways passing beneath vibration-sensitive buildings. Figure 10.8 shows the key principle: the rails and fasteners are carried by a massive track slab that is dynamically decoupled from the tunnel invert by resilient isolators.
![Floating slab track in a tunnel, showing the vehicle envelope, floating slab and elastomeric mounts [151].](../../assets/chapters/ch10/original/figures_source/fig_floating_slab_track_thompson_13_20.png)
The main disadvantage is cost: FST systems typically cost 5–15 times more than conventional ballasted track per track-metre. Their use is therefore restricted to locations where vibration impact on sensitive receptors cannot be addressed by less expensive measures [151, 105].
10.5.3 Noise Barriers
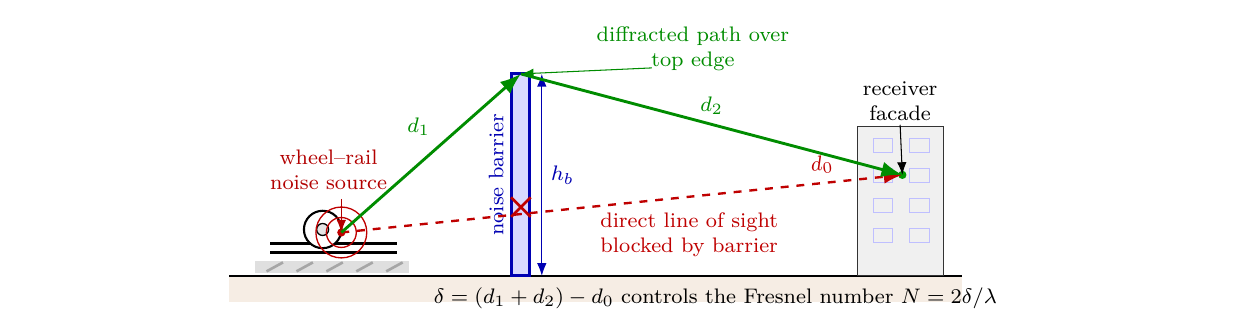
Noise barriers (screens, støyskjermer) are a well-established propagation-path measure. They intercept the direct sound path from the track to receivers and reduce noise by diffraction around the barrier top edge. The insertion loss \(IL\) of a thin barrier in a free field is approximately:
where \(\delta\) is the path length difference (detour over the barrier top) and \(\lambda\) is the wavelength at frequency \(f\). The Fresnel number \(N = 2\delta/\lambda\) determines the ideal single-frequency performance: the higher \(N\), the greater the insertion loss. In real railway projects, broadband \(L_{den}\) reduction is usually lower because of source height, ground effects, reflections, leakage, receiver height, and the train noise spectrum. Figure 10.9 gives the geometry used to define the wheel–rail noise source, the blocked line of sight, and the diffracted path over the barrier top edge.
Worked example.
Using Figure 10.9, assume that the barrier just blocks the direct line of sight between the wheel–rail source and a receiver. Let the distance from the source to the barrier top be \(d_1 = 3.0\) m, the distance from the barrier top to the receiver be \(d_2 = 6.2\) m, and the unobstructed direct distance be \(d_0 = 9.1\) m. The path length difference is therefore
For the wavelength calculation, \(c\) is the speed of sound in air and \(f\) is the frequency. At the 500 Hz octave-band centre, using \(c = 340\) m/s,
Substituting \(N = 0.29\) in Equation 10.2 gives
This value should be read as an ideal single-frequency screening estimate. The achievable broadband reduction for a real railway barrier will usually be lower after source height, leakage, reflections, ground conditions, and the train noise spectrum are included. The same geometry gives a larger ideal insertion loss at higher frequencies because the wavelength is shorter.
The engineering choice is not only height; absorptive surface, maintainability, access, visual impact, snow clearance, and available corridor width all matter. Bane NOR's technical regulations specify a minimum screen-material mass of \(15\,\mathrm{kg\,m^{-2}}\), recommend absorptive material where reflections are important, and distinguish conventional high screens from low screens placed close to the source [43]. Figure 10.10 gives one conventional trackside example: the continuous wall is placed between the railway and nearby houses, interrupting the direct line of sight from the wheel–rail source to the receivers.
![Example of a conventional trackside railway noise barrier separating the line from nearby receivers [140].](../../assets/chapters/ch10/original/figures_lecture_crops/fig_railway_noise_barrier_commons.jpg)
10.5.4 Low-Noise Wheels and Damped Wheels
Wheel vibration accounts for up to 30% of total rolling noise energy on some vehicles. Mitigation measures applied to the wheel include:
-
Wheel dampers: constrained-layer damping elements (tuned absorbers or ring dampers) bonded to the wheel web. They add damping to the primary radiating modes, reducing wheel radiated noise by 3–8 dB.
-
Optimised wheel profiles: profiles that reduce the equivalent conicity and maintain the roughness spectrum in a low-radiation range.
-
Composite brake blocks: K-blocks that produce a smooth tread surface, reducing tread roughness and hence rolling noise by 8–12 dB compared with cast-iron block-braked vehicles [151].
In Bane NOR's public technical-regulation material, low-noise wheel design is handled indirectly rather than through one prescribed damper geometry. The rail-maintenance rules control the wheel–rail interface by evaluating track equivalent conicity against reference wheel profiles such as S1002 and GV 1/40, with speed-dependent limit values. The Network Statement also requires frequency-based noise-emission data when new rolling stock is introduced on the national railway network, or when modifications to existing rolling stock change the nature of the noise emission. These requirements support acoustic acceptance and compatibility checks, but they should not be read as a standard drawing of a particular damped-wheel construction [13, 35].
10.5.5 Embedded and Slab Track
Embedded rail systems (see Chapter 2) encase the rail in a continuous elastomeric boot or cast elastomer layer. The elastomeric material provides:
-
Very high vibration isolation (natural frequency typically 5–12 Hz).
-
Excellent rolling noise reduction because the rail is heavily damped and radiation from both the rail web and foot is absorbed.
-
Elimination of rail fasteners and fastener-related maintenance.
Embedded rail is standard in urban tramway and light rail applications and is increasingly used for heavy urban rail [65].
10.6 Noise in Tunnels
The acoustic environment inside a railway tunnel is fundamentally different from open air. Key phenomena include:
-
Tunnel resonances: the tunnel cross-section acts as a waveguide. For a simplified circular tunnel of equivalent radius \(r\), plane wave propagation below the approximate cut-off frequency \(f_c \approx c/(2r)\) dominates. With \(r \approx 4.0\) m and \(c = 340\) m/s, this gives \(f_c \approx 40\) Hz. Real railway tunnels are not circular ducts, so modal behaviour depends on cross-section, lining, portals, and installed equipment.
-
Micro-pressure waves: in high-speed tunnels a pressure wave generated by the train entrance partially converts to a micro-pressure pulse at the tunnel exit, radiating as an audible impulsive "boom" outside the tunnel portal. This is mitigated by entrance hoods and hood vents, which increase the pressure-rise time and reduce the pressure gradient before the wave reaches the tunnel exit [126, 95].
-
Wheel squeal amplification: curve squeal and flange noise are amplified by the tunnel waveguide effect, particularly in curved tunnels.
Noise levels inside tunnels during train pass-by typically exceed 90–100 dB(A) at the tunnel wall, requiring careful attention to vibration in the tunnel lining and nearby structures.
10.7 Chapter Summary
Source mechanism. Rolling noise, traction noise, aerodynamic noise, impact noise, brake squeal and curve squeal are not interchangeable problems. Each source has a different dominant frequency range, speed dependence and physical origin. Rolling noise is governed mainly by combined wheel and rail roughness, while traction noise dominates at low speed and aerodynamic noise becomes important only at higher speeds. Correct diagnosis is therefore the first step in mitigation.
Transmission path. Airborne noise radiates from the wheel, rail, vehicle body or infrastructure and travels through the air to the receiver. Ground-borne vibration travels through the track, soil and building foundations, and may be felt directly or re-radiated as indoor low-frequency noise. This distinction matters because a noise barrier can reduce airborne sound but has little effect on vibration transmitted through the ground.
Assessment quantities. Railway noise is commonly described using A-weighted levels, equivalent levels and day–evening– night indices such as \(L_{den}\), while maximum levels are relevant for night-time events and sleep disturbance. Vibration assessment uses velocity-based quantities and statistical descriptors such as \(v_{w,95}\). The Norwegian regulatory framework connects these quantities to planning and assessment practice, so the engineer must understand both the physical quantity and the criterion being applied.
Mitigation chain. Rail grinding, wheel maintenance, K-block brakes and damped wheels act mainly at the source. Resilient rail pads, under-sleeper pads, under-ballast mats and floating slab track change the transmission path through the track and ground. Barriers and facade measures act closer to the receiver. A measure that is effective for one part of the chain may be ineffective or even counterproductive for another, so mitigation selection should follow the diagnosed mechanism.
Special environments. Tunnels, slab track, embedded track and dense urban corridors can change the acoustic and vibration response substantially. Tunnel waveguide effects, micro-pressure waves, re- radiated indoor noise and resilient-track deflection all require interpretation beyond a simple pass-by noise calculation. The overall implication is that railway environmental assessment is not only about decibel arithmetic; it is about tracing the physical path from train operation to human exposure.
Assignments
Assignment 1: Railway noise source diagnosis
A railway corridor passes through a residential area. Residents report four different problems:
(i) a low-frequency engine and fan noise when trains wait at the station,
(ii) a broadband pass-by noise from freight trains at 90–120 km/h,
(iii) a tonal "singing" noise on one tangent-track section, and
(iv) a sharp squeal from a 250 m radius curve near a platform.
(a) Classify each complaint as traction noise, rolling noise, corrugation noise, curve squeal, impact noise, aerodynamic noise, or ground-borne vibration.
(b) For each complaint, identify whether the first investigation should focus mainly on the vehicle, the wheel–rail contact, the track condition, the propagation path, or the receiver.
(c) Choose one measurement or inspection method that would help confirm each diagnosis.
Assignment 2: Rolling noise speed and roughness
A freight train travels at \(v_1 = 100\) km/h and generates a pass-by noise level of \(L_A = 82\) dB(A) at 25 m from the track.
(a) Using \(\Delta L_A = 30\log_{10}(v_2/v_1)\), calculate the rolling-noise level if speed is increased to \(v_2 = 160\) km/h.
(b) For the original train at 100 km/h, assume the wheel roughness level in the dominant wavelength band is \(L_{r,w}=46\) dB and the rail roughness level is \(L_{r,r}=42\) dB. After replacing cast-iron brake blocks with composite K-blocks, the wheel roughness falls to \(L_{r,w}=36\) dB while the rail roughness is unchanged. Use
to estimate the change in combined roughness and the corresponding rolling-noise reduction.
(c) Explain why this rolling-noise reduction is smaller than the 10 dB reduction in wheel roughness.
(d) State why aerodynamic noise is not normally the controlling source for this freight-train speed range.
Assignment 3: Day–evening–night railway noise assessment
A dwelling located 30 m from a railway line experiences the following equivalent noise levels: \(L_d = 62\) dB(A) (daytime), \(L_e = 58\) dB(A) (evening), \(L_n = 55\) dB(A) (night).
(a) Calculate \(L_{den}\) for the dwelling and comment on whether it satisfies the relevant T-1442 railway planning value.
(b) Explain why this differs from the T-1442 nighttime maximum-level check using \(L_{5AF}\).
(c) If source and path measures reduce all three equivalent levels by 8 dB(A), recalculate \(L_{den}\) and comment on compliance.
Assignment 4: Mitigation choice for noise and vibration
A mixed passenger and freight line runs close to housing and then enters a short tunnel below a vibration-sensitive building. Measurements show outdoor rolling noise and indoor low-frequency rumble. A resilient-track option changes the simplified track support stiffness from \(C_t = 120\) to 60 kN/mm. Use \(Q = 100\) kN.
(a) Propose one source measure, one propagation-path measure, and one receiver measure. State which problem each measure addresses.
(b) Using \(\delta = Q/C_t\), compare rail deflection before and after the resilient-track option. Why is this only an indicator?
(c) Explain how under-sleeper pads or softer rail support can reduce vibration transmission, and state one disadvantage.
(d) Is a conventional noise barrier alone sufficient? Justify the answer using the source–path–receiver framework.