Railway Track Maintenance
In this chapter
17.1 Introduction and Maintenance Basics
Railway track is not a permanent structure in the traditional civil engineering sense: it degrades continuously under repeated traffic loading, environmental exposure, and the cumulative effects of countless wheel–rail interactions. Without systematic maintenance, track geometry deteriorates to the point where safe and comfortable train operation becomes impossible [130, 68].
Maintenance and renewal require substantial recurring expenditure. Bane NOR’s 2024 annual report [221] records NOK 8.8 billion spent on maintenance and renewal that year. Ageing infrastructure, traffic and environmental exposure all affect the work required; age alone is not a condition assessment. Planning therefore covers rails, sleepers and ballast together with the other infrastructure asset classes shown in Figure 17.1.
Chapter 5 introduced the machines that carry out the principal track interventions. This chapter builds on that machinery foundation and changes the emphasis from how the machines work to why, when, and where each maintenance intervention should be selected.
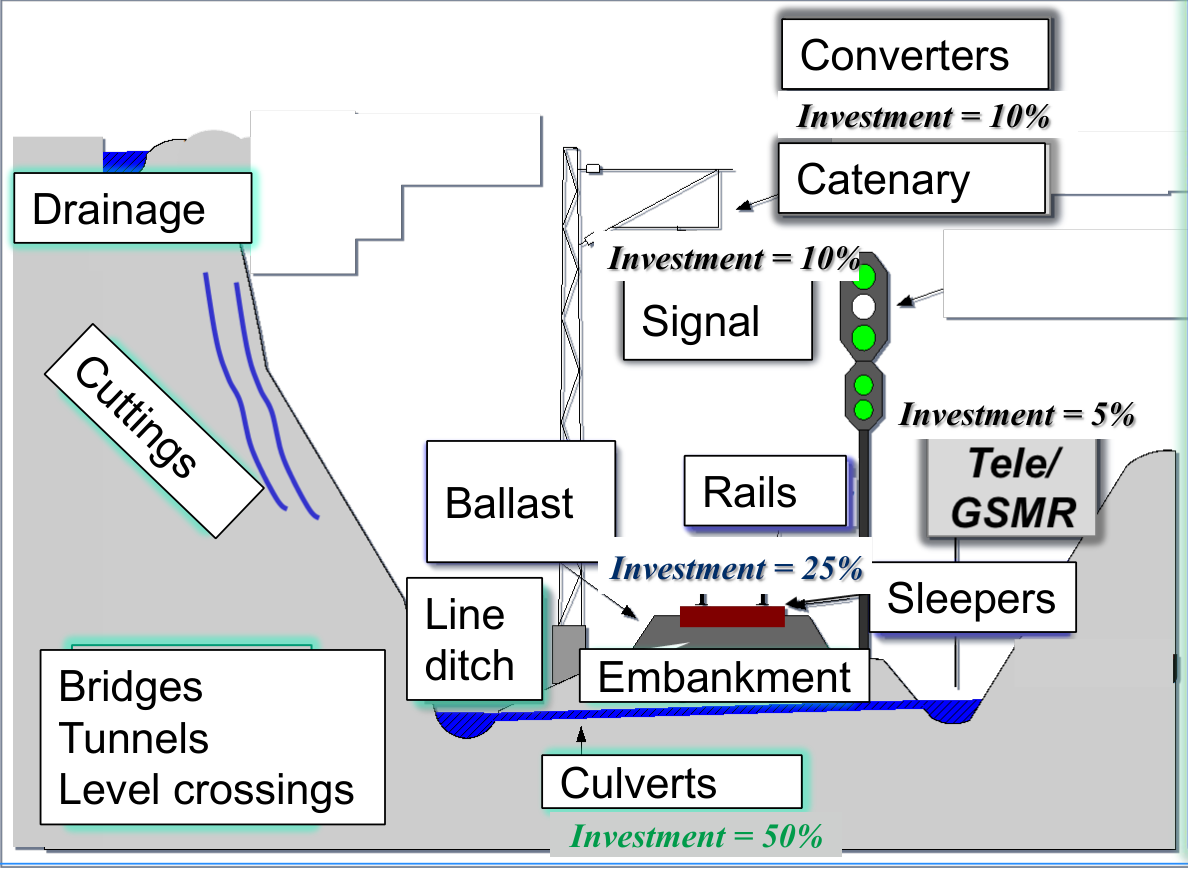
The primary goal of track maintenance is to preserve track geometry within the tolerance limits specified by Bane NOR technical regulations [10]. Secondary goals include extending component service life, preventing sudden failures, and ensuring cost-effective use of the maintenance budget. A structured approach that combines planned preventive activities with condition monitoring and corrective responses is essential to meet these goals while minimising traffic disruption.
The historical infrastructure overview in Figure 17.2(a) shows why long-lived structures remain part of the maintenance workload. The curve distribution in 17.2(b) helps explain why rail wear and guiding forces differ between routes. These are the lecture’s dated inventory illustrations, not a new survey of the network. An old bridge or formation can remain serviceable, while a much younger rail or fastening may already require intervention.
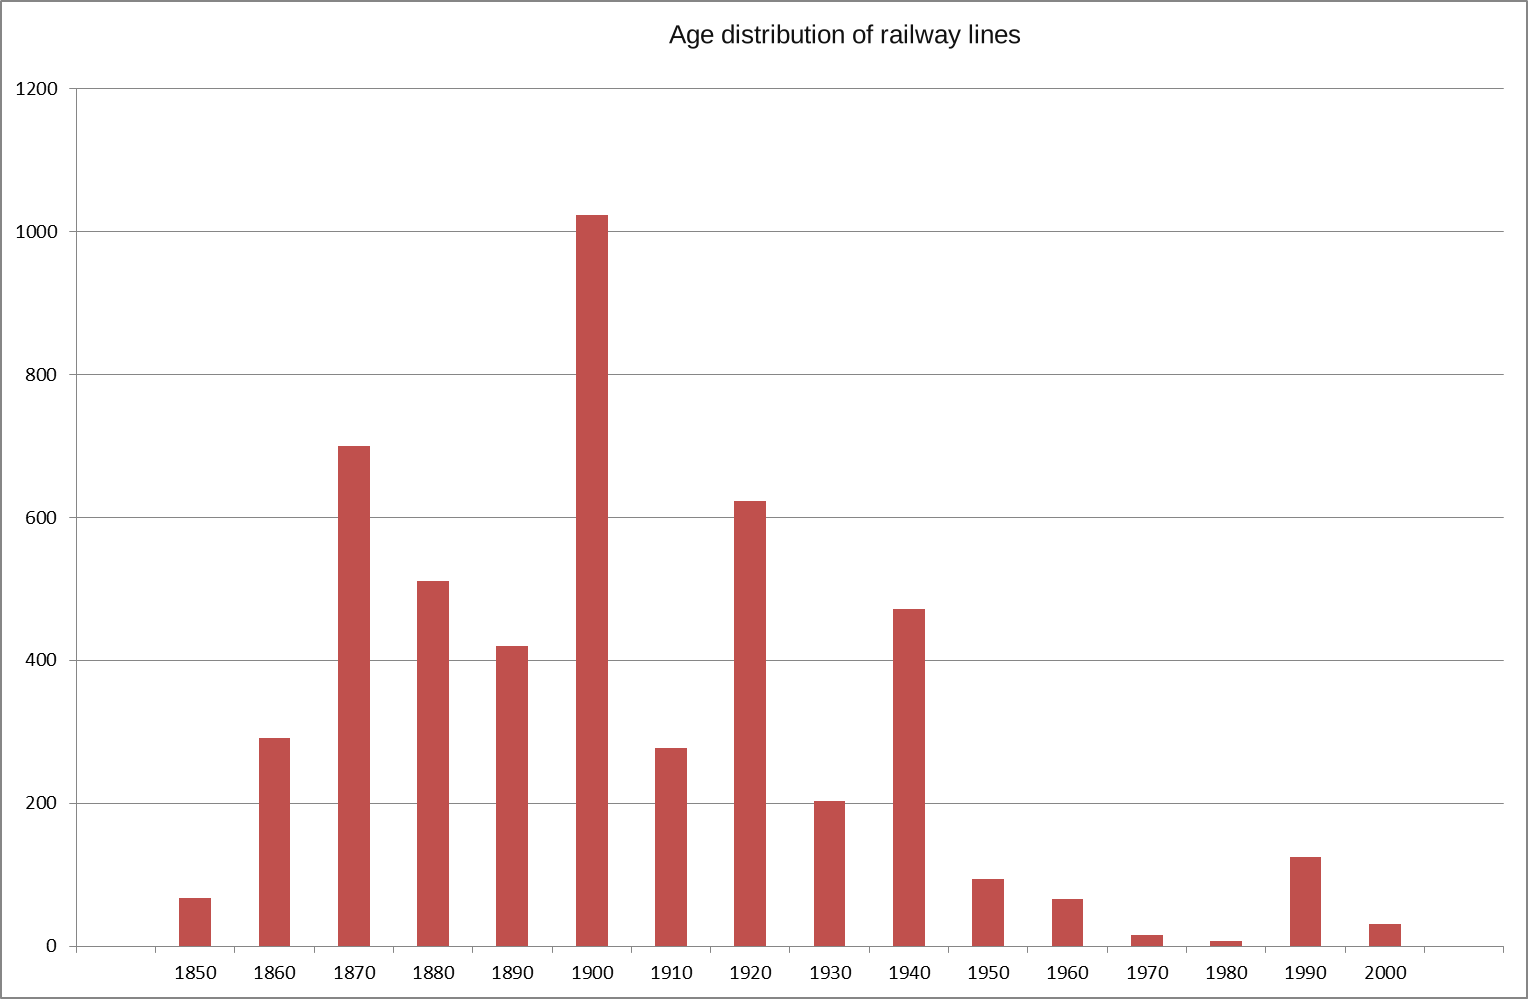
(a) Infrastructure age
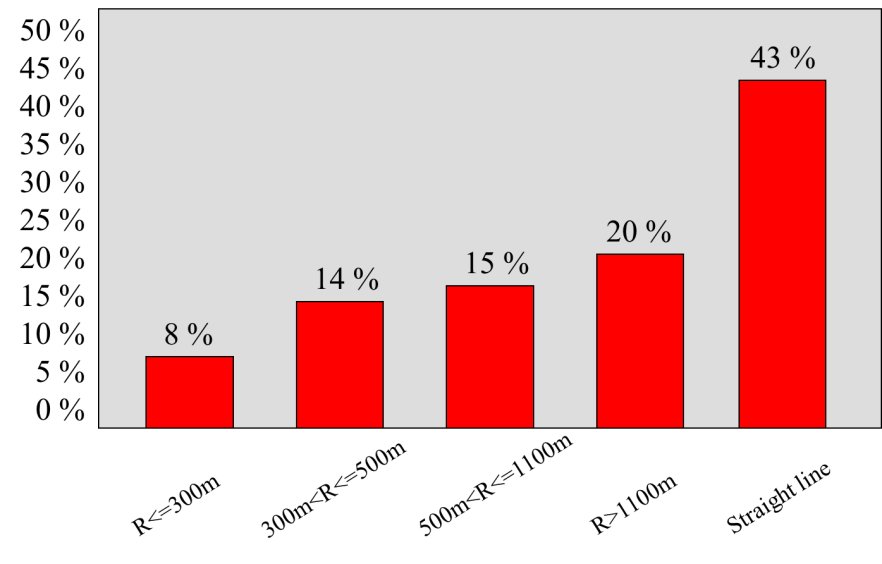
(b) Curve-radius distribution
17.1.1 Maintenance Definition and Classification
Maintenance includes the technical work, administration and management needed to retain or restore an asset’s required function. Its scope includes inspection, diagnosis, planning, materials, access to the track, execution and verification. The classification in Figure 17.3 distinguishes improvement, preventive and corrective maintenance. The following sections cover improvement, corrective work and preventive work in the lecture’s order.
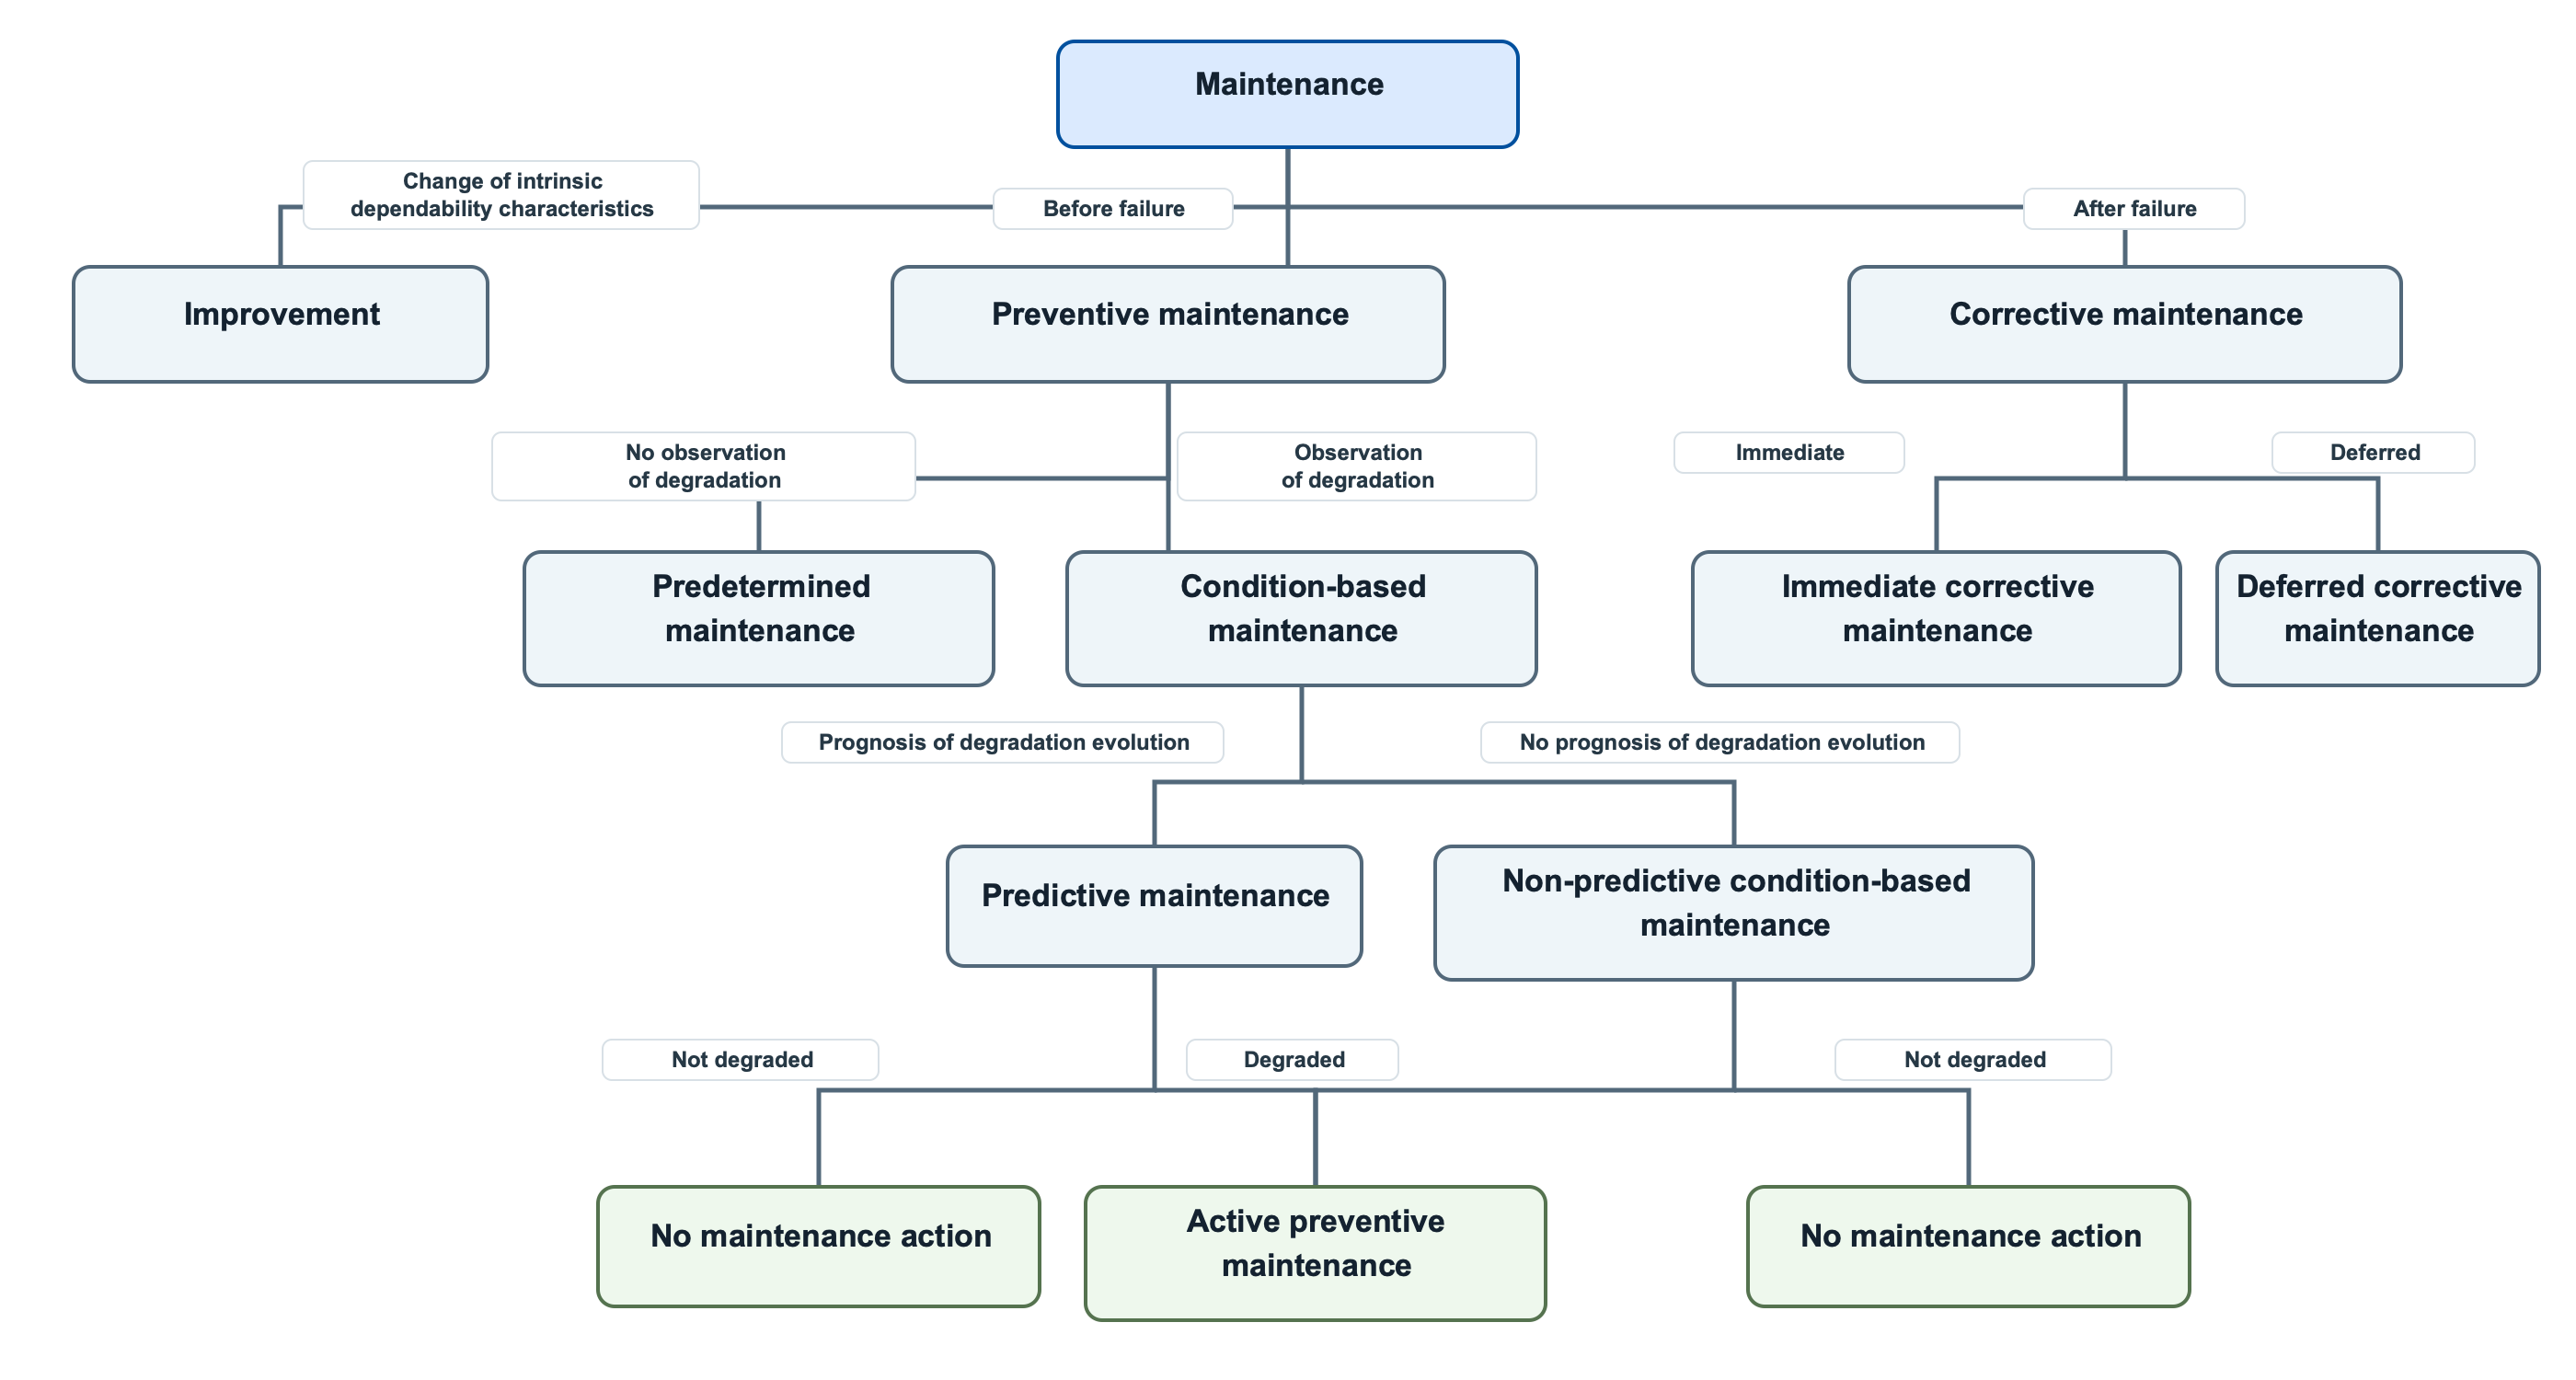
17.1.2 Improvement Maintenance
Improvement maintenance increases reliability, precision, maintainability or safety while retaining the required function. Replacing a component with a compatible, more reliable version is one example. The change needs an available and proven technology, a check of compatibility and new failure modes, and sufficient knowledge among the people who operate and maintain it. Renewal replaces life-expired assets; improvement and renewal may coincide, but the terms do not mean the same thing.
17.1.3 Corrective Maintenance
Corrective maintenance (reactive maintenance) is carried out after a defect has been detected or a component has failed. It restores functionality; preventing recurrence also requires identifying and addressing the cause. Examples include emergency rail replacement after a fracture, re-gauging after a misaligned fastening, or emergency re-levelling after a subgrade failure. Corrective maintenance is generally the most expensive type per unit of work because it often requires unplanned track possessions, premium labour rates, and urgent material procurement.
Immediate corrective work restores the function without unnecessary delay. Deferred corrective work allows diagnosis, prioritisation and planned resources when the assessed risk permits a delay. Downtime cost, reliability requirements and available redundancy affect that choice. Diagnosis identifies the failed part and its cause before replacement is ordered and the repaired function is tested.
In Bane NOR corrective-maintenance planning, the response is also classified by urgency. Urgent corrective maintenance (AKV) is undertaken without delay to avoid unacceptable consequences. Deferred corrective maintenance (UKV) is planned within a defined response category: UKV1 for a high probability of a safety-critical or service-stopping failure within 30 days, UKV2 for a high probability of a service-stopping failure within 365 days, and UKV3 where such a failure is not considered likely within those periods. The category must be based on consequence and deterioration risk; defect visibility alone is not a sufficient basis [46].
17.1.3.1 Worked Example: Maintenance Response
Question. Classify the response to four observations from a weekly maintenance review. Assume that each observation has been confirmed and that the stated consequence assessment is valid.
| Case | Observation | Classification and reason |
|---|---|---|
| A | A signal remains at red and prevents normal route operation. | AKV: restore the required function without delay and manage traffic until it is restored. |
| B | A culvert is partly blocked immediately before a period of forecast heavy rainfall. | UKV1: the near-term probability and consequence of rapid water-level rise justify action within 30 days, normally sooner. |
| C | Track-circuit values are approaching the service limit because the ballast is contaminated, but operation remains stable. | UKV2: plan corrective ballast/drainage work within the annual horizon before a service-stopping failure develops. |
| D | One isolated sleeper is defective, while gauge, fastening restraint, and neighbouring sleepers remain satisfactory. | UKV3: record and plan the replacement; the isolated condition does not currently indicate a likely stopping failure. |
Decision flow. First identify the lost or threatened function. Then estimate the time horizon to a safety-critical or service-stopping consequence. Finally, choose the response category and document any temporary controls, inspection interval, possession, materials, and completion deadline. The same physical defect may move from UKV3 to UKV1 if its extent, traffic exposure, weather, or degradation rate changes. A defensible decision combines this urgency logic with measured geometry and condition trends rather than classifying from appearance alone.
17.1.4 Preventive Maintenance
Preventive maintenance is carried out at predetermined intervals or when condition indicators reach defined thresholds, before failure occurs. The objective is to slow deterioration and preserve acceptable condition. An intervention such as tamping improves geometry but does not return every component to new condition. The most important preventive maintenance operation for ballasted track is tamping, which corrects accumulated geometry errors by lifting sleepers and compacting ballast beneath them. Preventive grinding of rails removes surface rolling contact fatigue (RCF) cracks before they penetrate to the dangerous sub-surface zone.
Predetermined maintenance follows a time or usage interval. Its predictable timing helps coordinate work requiring the same location, equipment or possession. Condition-based maintenance follows measured degradation and a defined intervention criterion. It can use more of the component’s useful life, but requires dependable observations and follow-up. Predictive models estimate when a limit will be reached; non-predictive condition checks assess whether action is already required. Both can use on-site inspection, and a satisfactory inspection may lead to no intervention.
17.1.5 Advantages and Limitations
Table 17.1 compares the strategies. Simple short-term corrective planning can produce unpredictable failures, high long-term cost and inefficient emergency use of equipment and staff. Preventive work improves reliability, scheduling and safety, but excessive work wastes material and labour and does not eliminate every unplanned failure. Improvement can increase performance and efficiency, while introducing unfamiliar technology and competence requirements.
| Strategy | Advantages | Limitations |
|---|---|---|
| Corrective | Low immediate planning cost. | High disruption, high safety exposure, and often expensive short-notice possessions. |
| Preventive | Predictable possessions and resource planning. | May replace or disturb assets before their full technical life is used. |
| Condition-based | Uses measured condition and degradation trends. | Requires reliable inspection data, thresholds, and trend interpretation. |
| Improvement | Improves reliability, safety or maintainability while retaining the required function. | Requires compatibility checks, investment and competence in the changed equipment. |
17.1.6 Maintenance Strategy in Norway
Bane NOR's maintenance strategy is based on the principle of condition-based preventive maintenance: inspections and measurements are carried out at regular intervals, and maintenance work is triggered when condition indicators fall below defined thresholds, rather than at fixed calendar intervals [10, 152].
Key elements of the Norwegian strategy include:
-
Track geometry measurement by diagnostic trains, at intervals set by the applicable preventive-maintenance programme.
-
Automated analysis of geometry data to calculate quality indices (TQI) and identify sections requiring intervention.
-
Risk-based prioritisation: sections with high traffic, high speed, or safety-critical geometry errors receive priority intervention.
-
Life-cycle planning: renewal decisions are based on whole-life cost analysis comparing continued maintenance with component replacement.
17.1.7 The Bathtub Curve and Asset Degradation
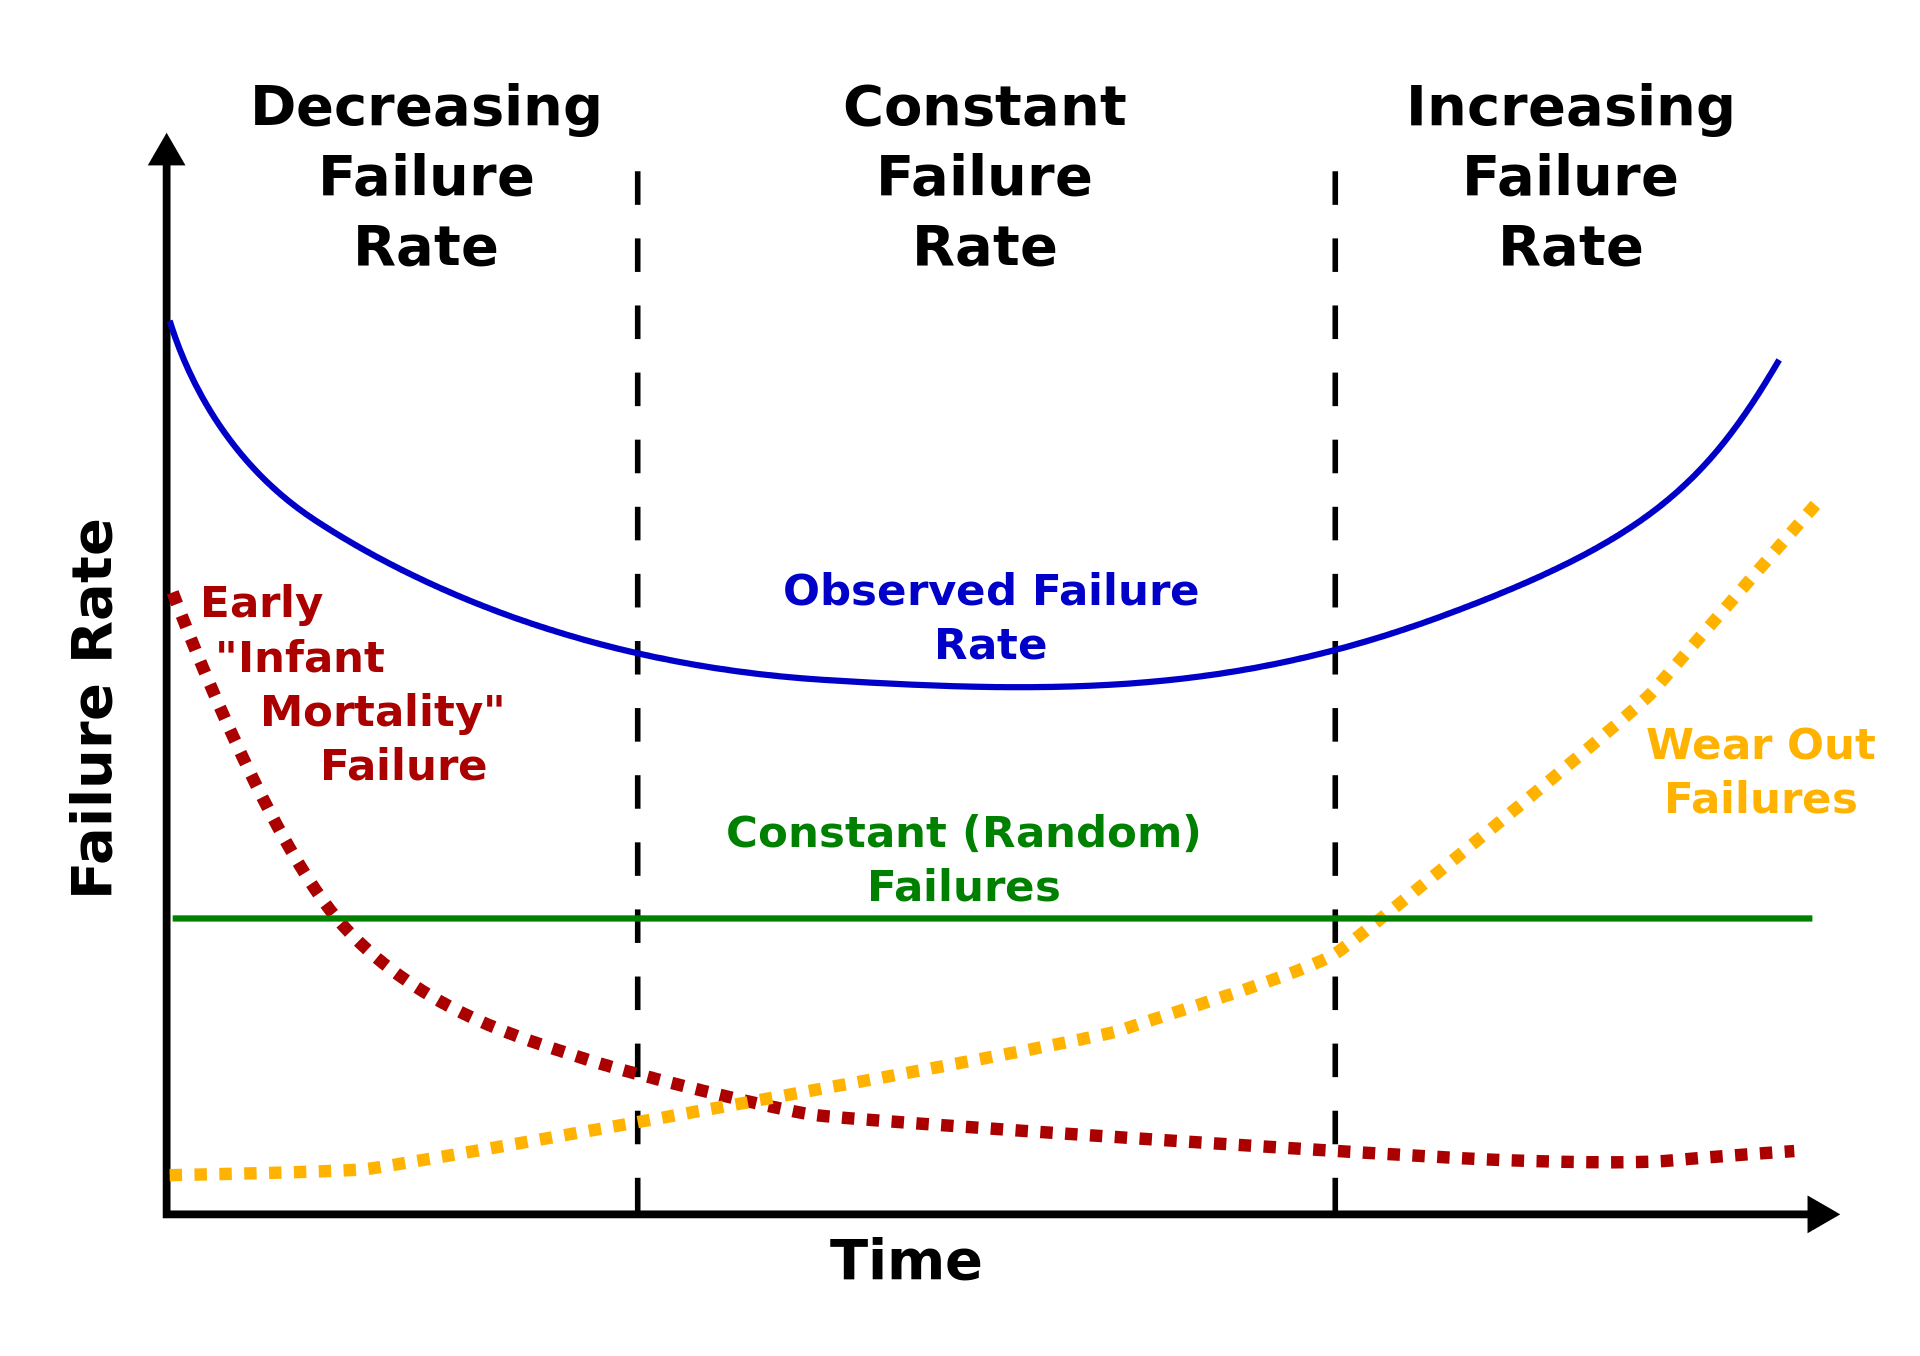
The service life of a track component can be described by the bathtub curve, which plots the instantaneous failure rate against time [130]:
-
Early or "infant mortality" failures: The left-hand part of Figure 17.4 shows a decreasing failure rate. Failures are initially more likely because new or recently disturbed components are still bedding in, installation defects may be exposed, and ballast disturbed by tamping or renewal is consolidating under traffic.
-
Constant or random failures: The middle part of the curve represents a roughly constant failure rate. For track assets this is the target operating regime, where failures are not mainly caused by age but by random events, local defects, unusual loads, drainage problems, or isolated component weaknesses.
-
Wear-out failures: The right-hand part of the curve shows an increasing failure rate as fatigue damage, wear, corrosion, ballast fouling, and material degradation accumulate. In this region corrective maintenance becomes less effective, and renewal or major intervention becomes economically necessary.
The blue combined failure-rate curve in Figure 17.4 illustrates these three mechanisms acting together. It explains why newly disturbed track, mature track and worn-out components require different inspection and maintenance responses.
The same idea can be considered at two time scales. Repairing or replacing one component restarts its local history, while the surrounding system continues to age. Routine component care, service-life extension and measures against accelerated deterioration therefore operate within a longer renewal cycle. A local improvement does not reset the age or condition of the complete track system.
17.1.8 The Degradation Process
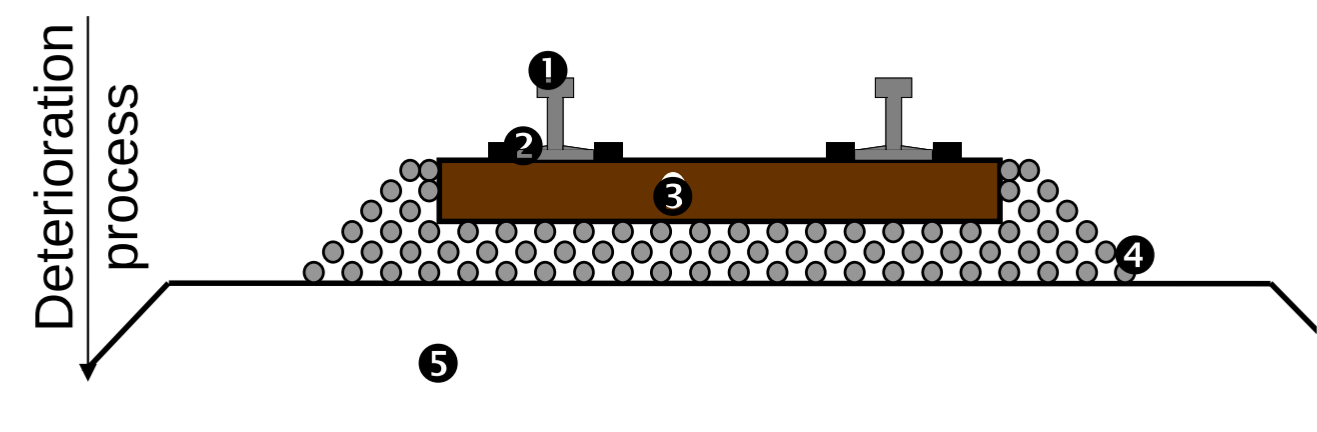
Figure 17.5 follows the deterioration mechanism through (1) the rail, (2) the fastening, (3) the sleeper, (4) the ballast and (5) the subgrade. Uncorrected rail-surface irregularities increase dynamic loading. The additional forces pass through the fastening and sleeper into the ballast, promoting particle breakdown and settlement. Repeated movement and water can then pump fines into the ballast and weaken the formation. Early treatment matters because the defect can spread beyond the component where it first appeared.
17.2 Track Geometry Quality
Track geometry quality is the part of maintenance most directly tied to what is measured on the track. The purpose is to name the geometry parameters, see what they look like, understand how they are measured, and then read the tolerance limits that decide whether the defect can wait for planned maintenance or needs immediate attention. The presentation below follows the same sequence for each parameter: definition, figure, tolerance table, and maintenance interpretation.
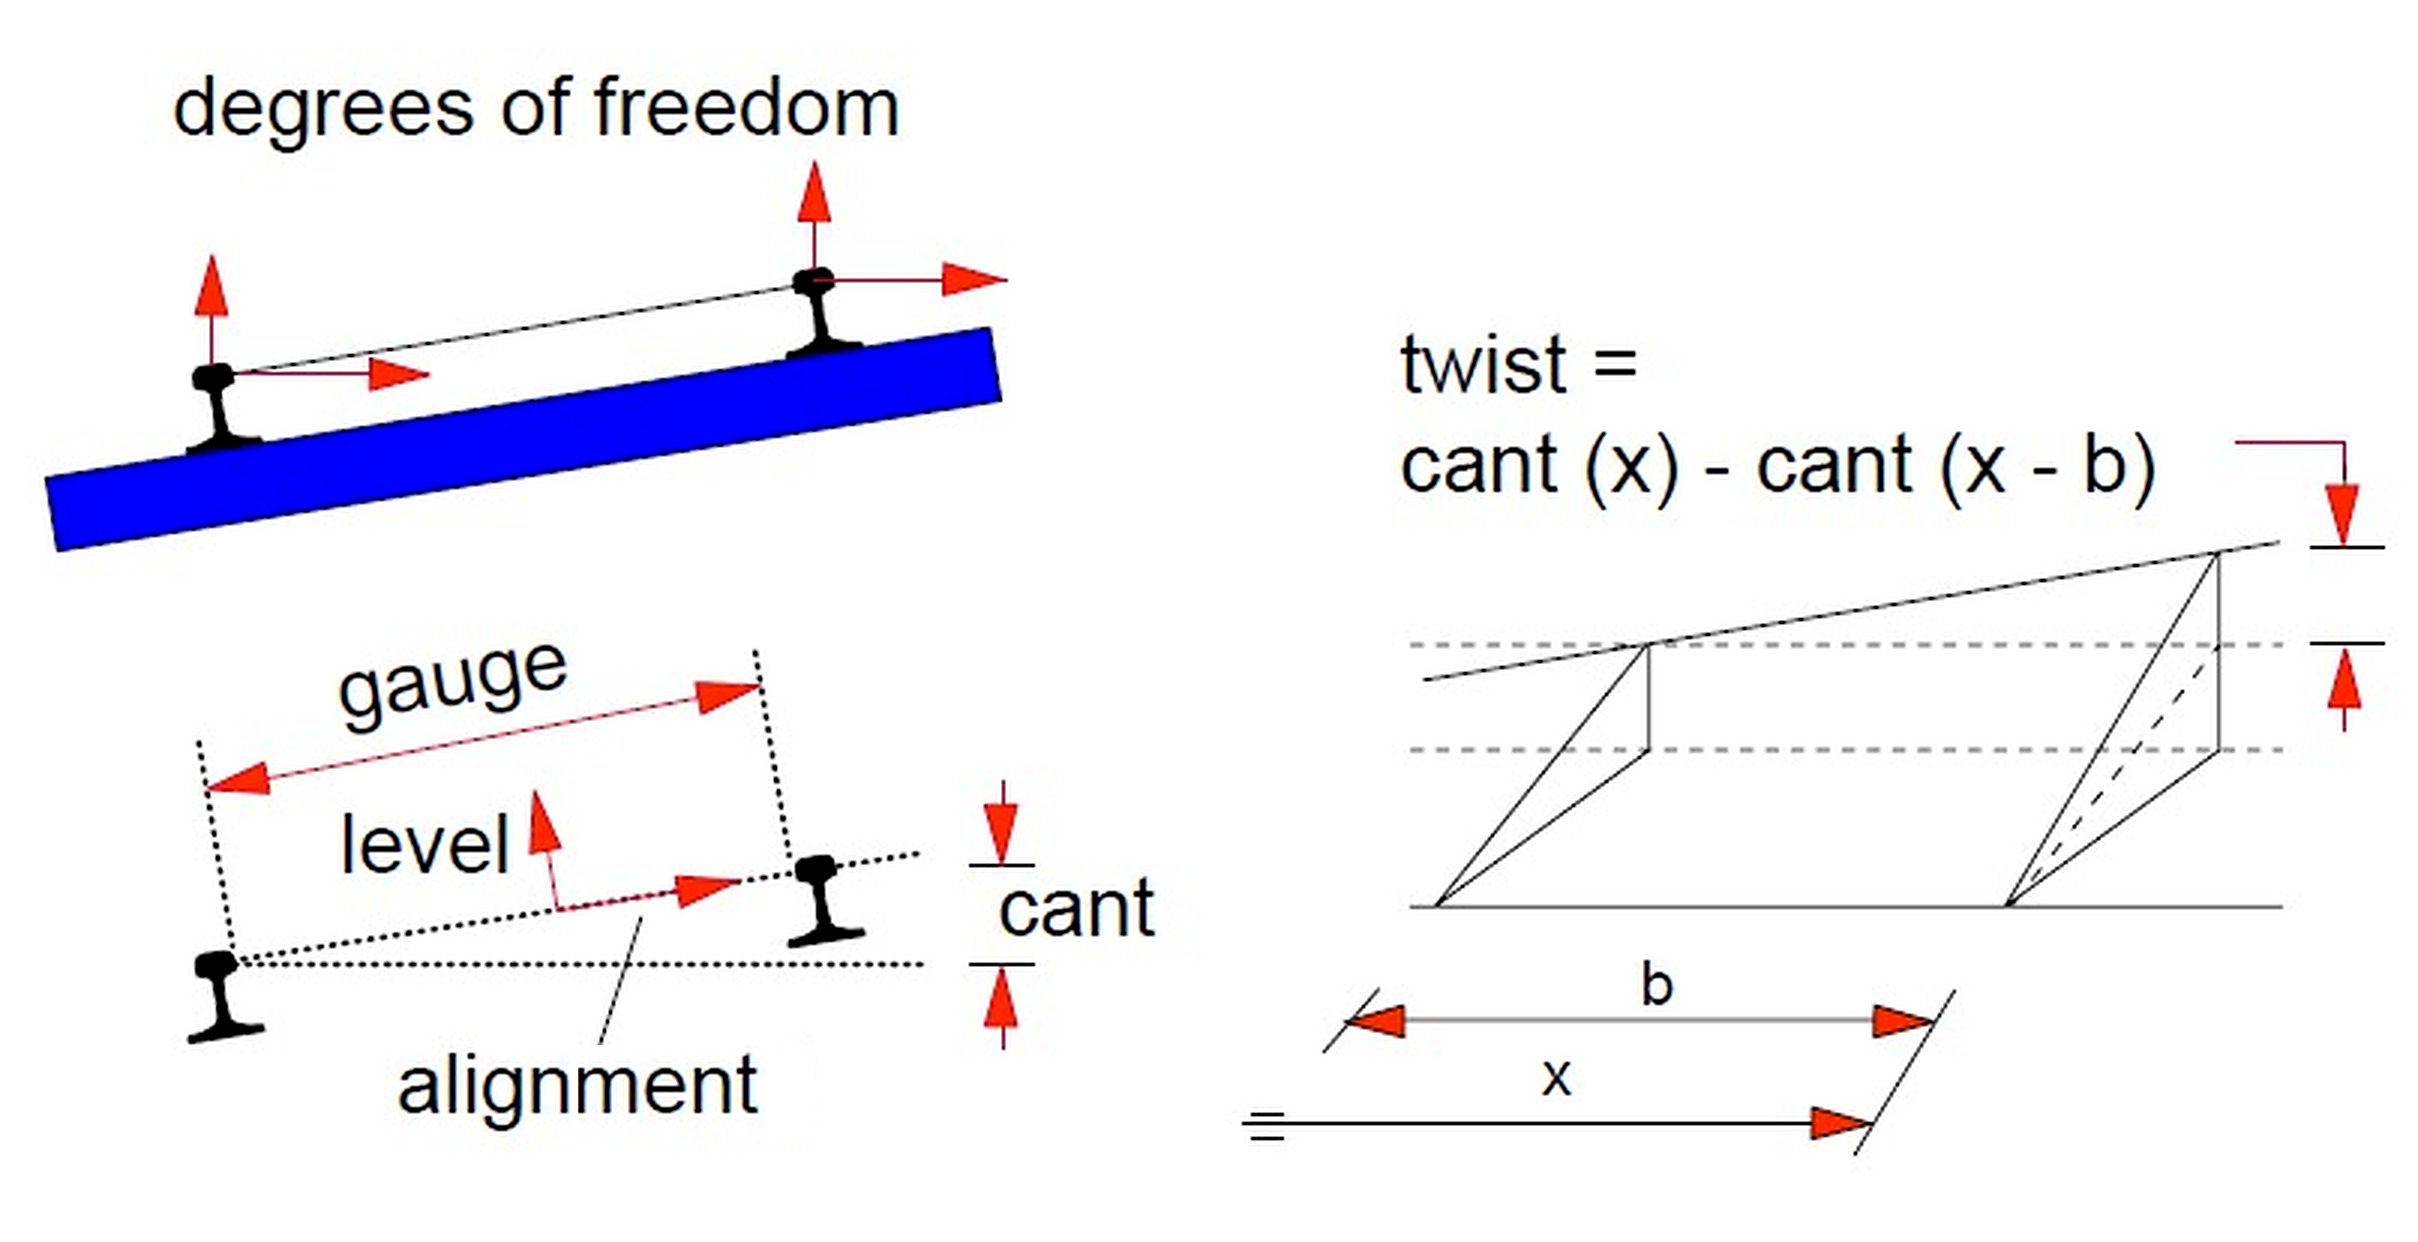
Diagnostic trains measure the geometry continuously at line speed, while local follow-up can use manual gauges, chord measurements and levelling. Figure 17.6 gives the compact overview: gauge acts across the rails, longitudinal level acts vertically along each rail, horizontal alignment acts laterally in plan, cross-level or cant acts between the rails, and twist is the change in cant over a measuring base.
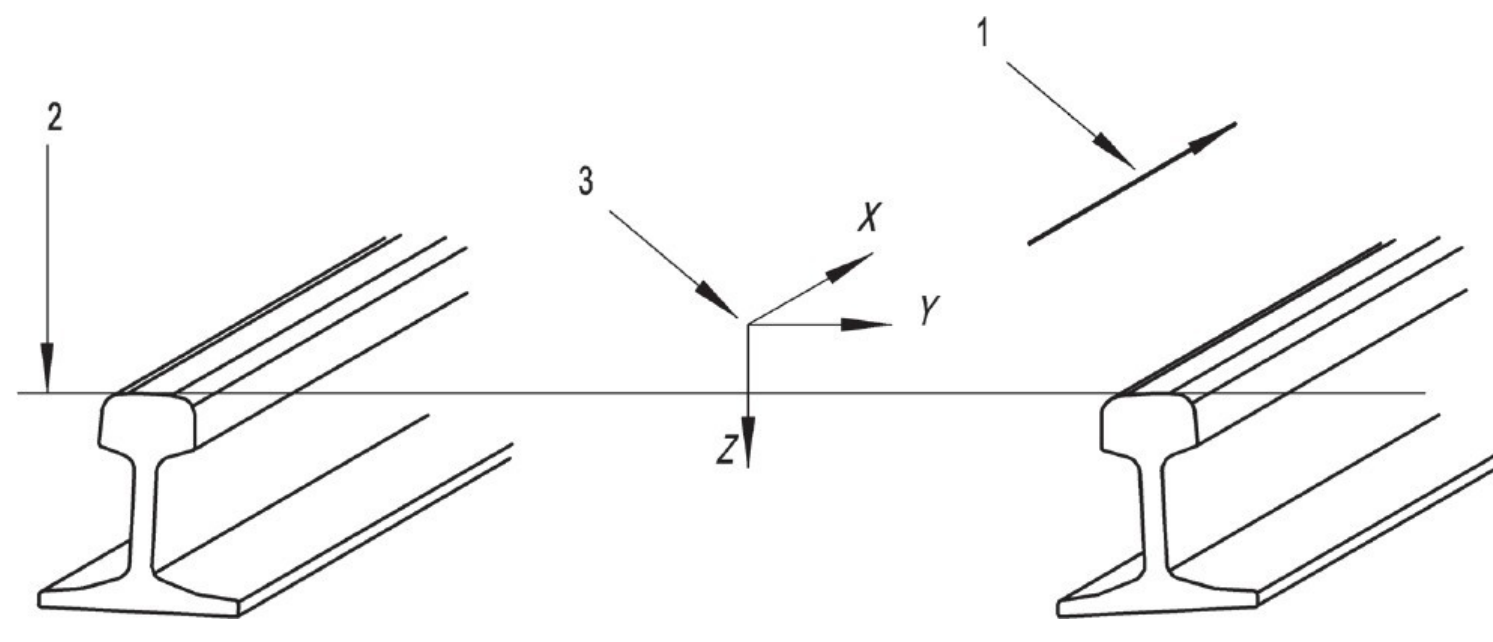
In Figure 17.7, label 1 marks the running direction, 2 the running surface and 3 the track coordinate system. The x-axis follows the track, y is lateral and z is normal to the running surface. Longitudinal level and horizontal alignment are relative deviations in these axes. The reference line is smoothed over a length appropriate to the wavelength range, rather than chosen as an arbitrary straight line. The lecture distinguishes D1 (3–25 m), D2 (25–70 m) and a longer D3 range for high-speed assessment.
17.2.1 Quality Classes and Limit Levels
Bane NOR technical regulations classify geometry limits by quality class, measurement basis and wavelength band [46, 50]. The quality class follows the highest permitted line speed, as shown in Table 17.2.
| Quality class | Line speed |
|---|---|
| Q0 | \(230 < V \leq 300\) km/h |
| Q1 | \(160 < V \leq 230\) km/h |
| Q2 | \(120 < V \leq 160\) km/h |
| Q3 | \(80 < V \leq 120\) km/h |
| Q4 | \(40 < V \leq 80\) km/h |
| Q5 | \(V \leq 40\) km/h |
Worked examples may use an individual quality class, such as Q2, but the regulation covers all quality classes rather than a single row. The full Bane NOR rows are therefore reproduced below for each parameter. The limit levels should be read as follows: exceeding the maintenance limit means the defect should enter the planned maintenance programme; exceeding the action limit means the defect must be corrected and followed up before it can develop into an immediate defect; and exceeding the immediate limit means prompt repair and, where required, speed reduction until the defect is removed. Values in the following tables are in millimetres unless stated otherwise.
The tables reproduce the ordinary quality-class rows. The current Bane NOR rule [50] also has route-specific provisions: several checks use Q3 for the Ofotbanen superstructure class, and a separate gauge table applies to the stated heavy-haul conditions on Ofotbanen and Gullsmedvik–Ørtfjell. New-track gauge tolerances refer to measurement by a measuring train on track ready for traffic, not manual measurements before adjustment. The rule also distinguishes the response to excessive and insufficient gauge.
A dash in the D2 tables below means that this table specifies no value for that quality-class row. Values from a merged or simplified lecture table must not be extended to other classes without checking the current rule.
17.2.2 Track Gauge
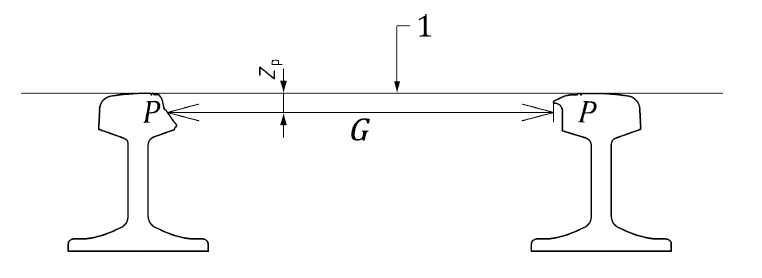
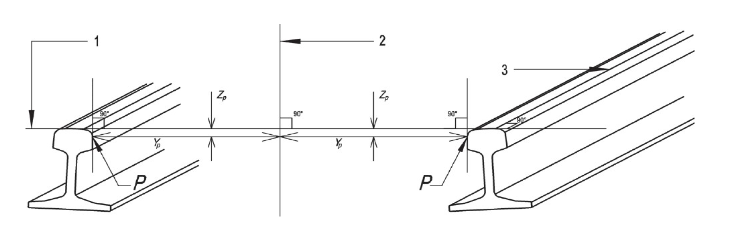
Track gauge is the distance between the inner rail faces. In the standard definition used for maintenance, it is measured at the gauge point below the running surface, not across the top of the rail head. In Figure 17.8, \(l_p\) denotes this vertical gauge-point depth; the standard track gauge \(G\) is measured between the inner running edges \(14\) mm below the rail-head top [50]. On the Norwegian network the nominal gauge is 1435 mm, so a gauge defect is read as a deviation from 1435 mm.
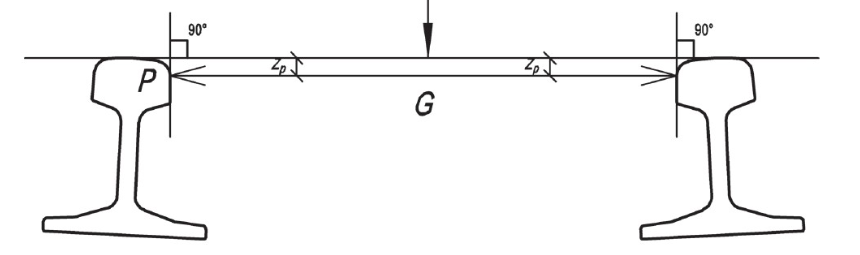
Figure 17.9 shows why the two gauge points need not occur at the same depth on worn heads. The lecture’s EN-style definition considers the smallest normal distance within the 0–14 mm rail-head band. For the Norwegian maintenance check, Bane NOR specifies measurement 14 mm below the track plane. The nominal gauge is 1435 mm; the 1437 mm design gauge used for manufacturing new sleepers is a different reference and must not replace nominal gauge in the deviation tables.
| Class | Line speed | New track | Maintenance | Action | Immediate |
|---|---|---|---|---|---|
| Q0 | \(230 < V \leq 300\) km/h | +3/-0 | +10/-3 | +15/-4 | +28/-5 |
| Q1 | \(160 < V \leq 230\) km/h | +4/-0 | +12/-4 | +20/-5 | +28/-7 |
| Q2 | \(120 < V \leq 160\) km/h | +4/-0 | +15/-5 | +25/-6 | +35/-8 |
| Q3 | \(80 < V \leq 120\) km/h | +4/-3 | +15/-7 | +30/-8 | +35/-9 |
| Q4 | \(40 < V \leq 80\) km/h | +4/-4 | +20/-7 | +30/-8 | +35/-9 |
| Q5 | \(V \leq 40\) km/h | +5/-5 | +20/-7 | +30/-8 | +35/-9 |
| Class | Line speed | Maintenance | Action |
|---|---|---|---|
| Q0 | \(230 < V \leq 300\) km/h | 7 | 10 |
| Q1 | \(160 < V \leq 230\) km/h | 8 | 10 |
| Q2 | \(120 < V \leq 160\) km/h | 9 | 10 |
| Q3 | \(80 < V \leq 120\) km/h | 10 | 15 |
| Q4 | \(40 < V \leq 80\) km/h | 12 | 18 |
| Q5 | \(V \leq 40\) km/h | 15 | 25 |
The first table controls how far the gauge may be from nominal. The second table controls how quickly it changes along the track, because a sudden change can be more critical for vehicle guidance than a slowly varying offset. Gauge widening is commonly linked to rail wear, rail head deformation, rail roll, loose fastenings, sleeper deterioration or poor construction control. Typical maintenance actions are correcting rail position, replacing fastenings or sleepers, and replacing worn rail where the gauge can no longer be held.
The profiles in Figure 17.10 locate flaking, rolling-contact-fatigue cracks, plastic flow and gauge-side wear. Their dashed original outlines show that wear changes the running edge as well as the rail-head shape. Rail roll, weak fastenings and poor sleeper support can add to the measured gauge deviation. Manual contact measurements on unloaded track and optical measurements under a recording vehicle therefore need a stated measurement basis.
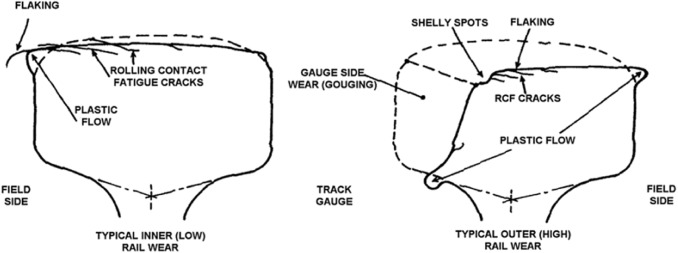
Figure 17.11(a) and 17.11(b) show machine-mounted and portable grinding. Grinding can correct a suitable rail-profile defect, but cannot restore a gauge held by a failed sleeper or fastening, or recover metal already lost through excessive wear. Those conditions require adjustment or component replacement. Excessive gauge, insufficient gauge and gauge variation have different vehicle-guidance consequences, including poor stability and, in severe cases, derailment.
(a) Vehicle-mounted grinding unit
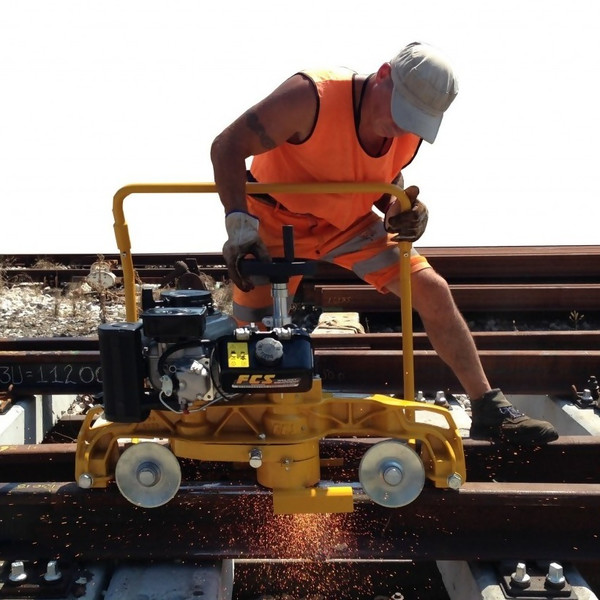
(b) Portable rail grinder
17.2.3 Longitudinal Level
Longitudinal level is the vertical position of each rail along the track. Figure 17.12 shows the measured running table compared with a smoothed reference line. The quantity is therefore not the absolute elevation of the track; it is the vertical deviation from the reference line within a specified wavelength band. Bane NOR gives separate limit tables for D1 (3–25 m) and D2 (25–70 m).
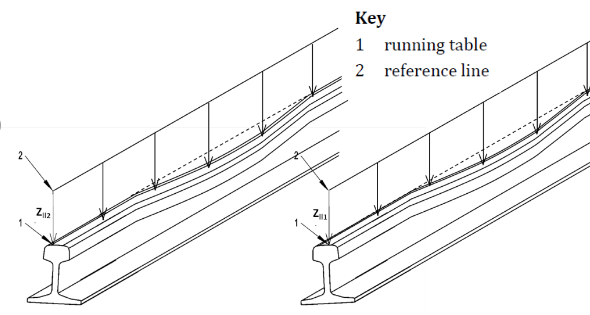
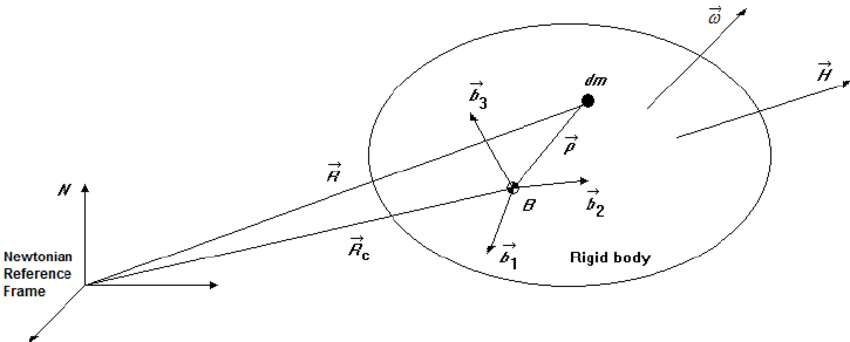
Figure 17.13(a) records the left and right rails separately; L and R identify the rail and L3–25 the displayed wavelength band. The support defect in 17.13(b) gives the physical counterpart to a measurement trace. The inertial-reference sketch in 17.13(c) distinguishes motion of the measuring body from the reference frame used to reconstruct geometry. Recording vehicles can use inertial, versine or combined systems; an asymmetric chord improves the response over the required wavelength range.
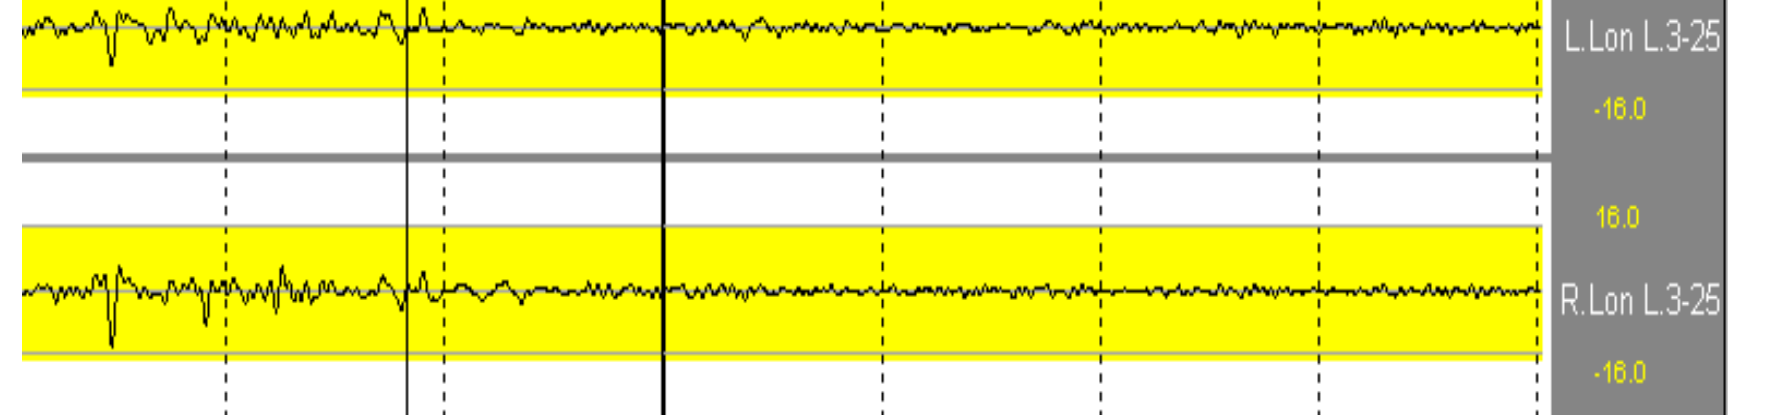
(a) Left and right rail traces
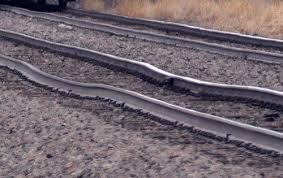
(b) Uneven vertical geometry
(c) Inertial reference
| Class | Line speed | New | Newly adjusted | Maintenance | Action | Immediate |
|---|---|---|---|---|---|---|
| Q0 | \(230 < V \leq 300\) km/h | \(\pm 2\) | \(\pm 2\) | \(\pm 6\) | \(\pm 8\) | \(\pm 16\) |
| Q1 | \(160 < V \leq 230\) km/h | \(\pm 2\) | \(\pm 2\) | \(\pm 6\) | \(\pm 9\) | \(\pm 20\) |
| Q2 | \(120 < V \leq 160\) km/h | \(\pm 2\) | \(\pm 2\) | \(\pm 10\) | \(\pm 12\) | \(\pm 23\) |
| Q3 | \(80 < V \leq 120\) km/h | \(\pm 3\) | \(\pm 4\) | \(\pm 13\) | \(\pm 16\) | \(\pm 26\) |
| Q4 | \(40 < V \leq 80\) km/h | \(\pm 3\) | \(\pm 5\) | \(\pm 15\) | \(\pm 19\) | \(\pm 28\) |
| Q5 | \(V \leq 40\) km/h | \(\pm 3\) | \(\pm 6\) | \(\pm 17\) | \(\pm 21\) | \(\pm 28\) |
| Class | Line speed | New | Newly adjusted | Maintenance | Action | Immediate |
|---|---|---|---|---|---|---|
| Q0 | \(230 < V \leq 300\) km/h | \(\pm 7\) | \(\pm 7\) | \(\pm 10\) | \(\pm 14\) | \(\pm 18\) |
| Q1 | \(160 < V \leq 230\) km/h | \(\pm 7\) | \(\pm 7\) | \(\pm 12\) | \(\pm 16\) | \(\pm 24\) |
| Q2 | \(120 < V \leq 160\) km/h | – | – | – | – | – |
| Q3 | \(80 < V \leq 120\) km/h | – | – | – | – | – |
| Q4 | \(40 < V \leq 80\) km/h | – | – | – | – | – |
| Q5 | \(V \leq 40\) km/h | – | – | – | – | – |
Longitudinal-level defects increase dynamic wheel loads and often reveal differential settlement, unstable support, frost heave, ballast pockets or incorrect tamping. If the vertical defect is mainly on one rail, the same support problem may also create twist. The usual remedy is tamping; if the defect returns quickly, the drainage, ballast or subgrade condition should be corrected before repeated tamping is specified.
The one-rail defect in Figure 17.14(a) changes cross-level as the vehicle moves along the track and can therefore create twist. A common vertical displacement of both rails has a different wheel-unloading effect, although it can still generate large dynamic loads. The machine in 17.14(b) lifts and lines the track and packs the sleeper support. Recurring faults require investigation of support and drainage, not just another correction pass.
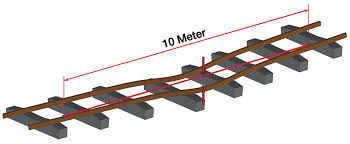
(a) Defect over a 10 m length
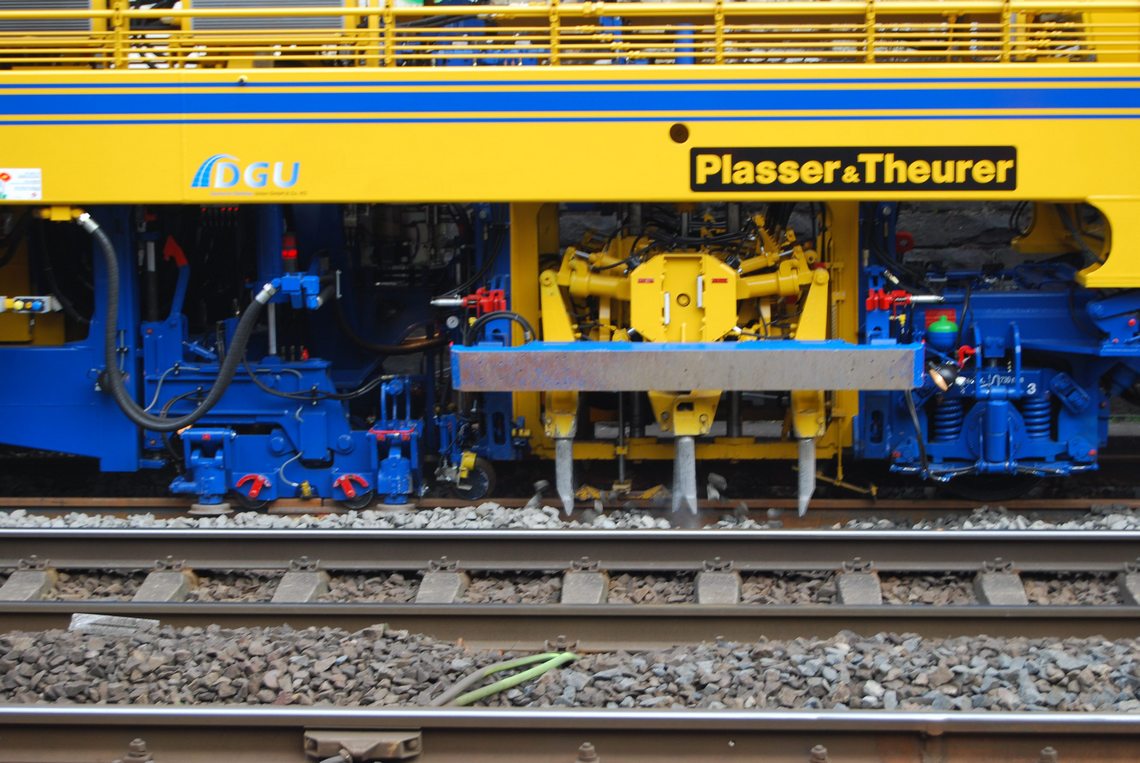
(b) Tamping and lining machine
17.2.4 Horizontal Alignment
Horizontal alignment is the lateral position of the rails in plan. Figure 17.15 shows the side error relative to a horizontal reference line. In maintenance, this is commonly evaluated as a versine or lateral deviation within the wavelength band, so the limit is much tighter than a visual estimate of the track centreline would suggest.
The two tracks in Figure 17.16(a) and 17.16(b) illustrate lateral displacement, but a photograph does not establish the numerical defect. The manual check in 17.16(c) uses the chord geometry in 17.16(d): a 10 m chord spans the rail and the midpoint offset is the versine. For a designed curve, the intended versine must be distinguished from the alignment error. Recording-vehicle filtering and a manual chord do not automatically have identical wavelength response.
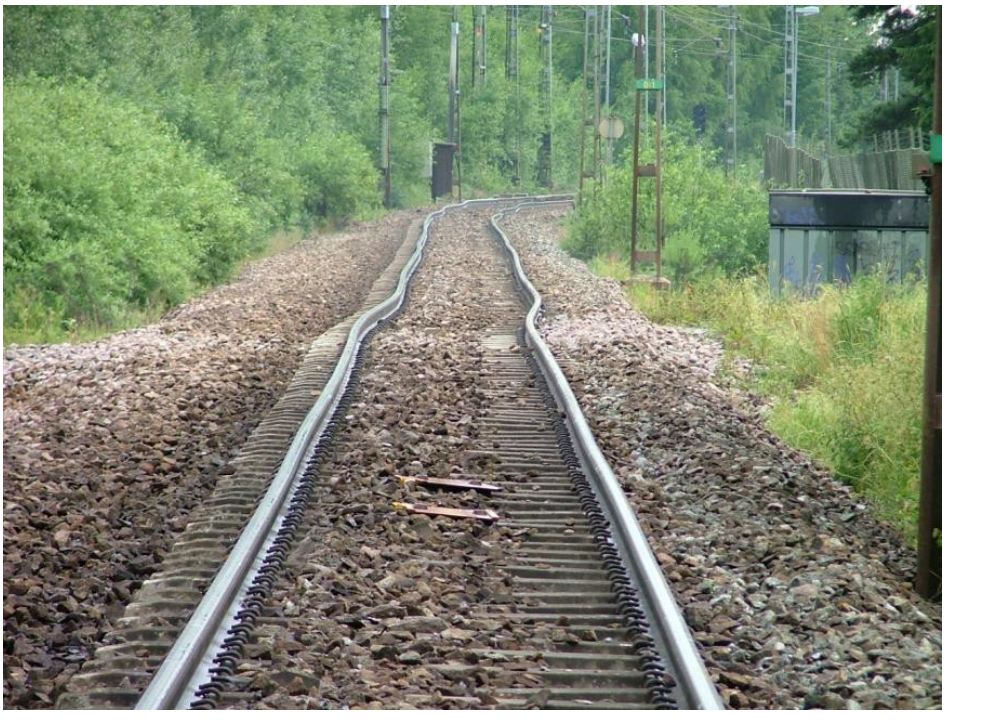
(a) Pronounced lateral irregularity
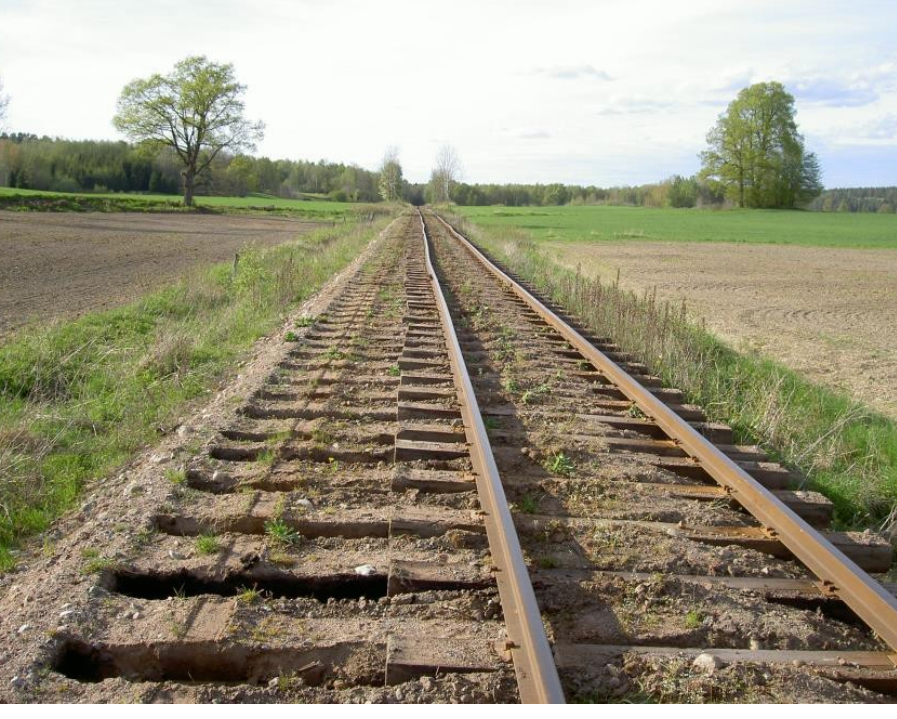
(b) Lateral displacement of the track
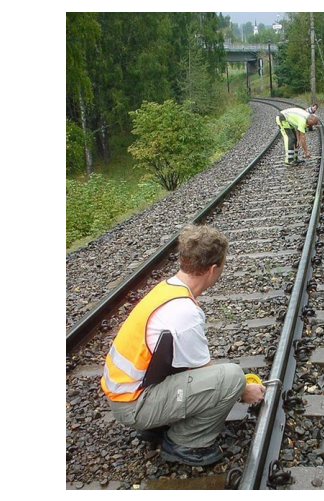
(c) Manual measurement
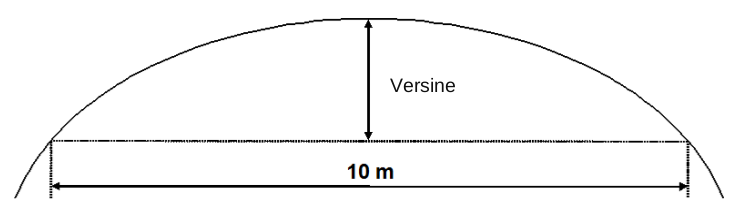
(d) 10 m chord and versine
| Class | Line speed | New | Newly adjusted | Maintenance | Action | Immediate |
|---|---|---|---|---|---|---|
| Q0 | \(230 < V \leq 300\) km/h | \(\pm 2\) | \(\pm 2\) | \(\pm 3\) | \(\pm 4\) | \(\pm 10\) |
| Q1 | \(160 < V \leq 230\) km/h | \(\pm 2\) | \(\pm 2\) | \(\pm 3\) | \(\pm 4\) | \(\pm 12\) |
| Q2 | \(120 < V \leq 160\) km/h | \(\pm 2\) | \(\pm 2\) | \(\pm 4\) | \(\pm 5\) | \(\pm 14\) |
| Q3 | \(80 < V \leq 120\) km/h | \(\pm 2\) | \(\pm 3\) | \(\pm 5\) | \(\pm 7\) | \(\pm 17\) |
| Q4 | \(40 < V \leq 80\) km/h | \(\pm 2\) | \(\pm 3\) | \(\pm 8\) | \(\pm 11\) | \(\pm 22\) |
| Q5 | \(V \leq 40\) km/h | \(\pm 2\) | \(\pm 4\) | \(\pm 10\) | \(\pm 14\) | \(\pm 22\) |
| Class | Line speed | New | Newly adjusted | Maintenance | Action | Immediate |
|---|---|---|---|---|---|---|
| Q0 | \(230 < V \leq 300\) km/h | \(\pm 5\) | \(\pm 5\) | \(\pm 10\) | \(\pm 12\) | \(\pm 14\) |
| Q1 | \(160 < V \leq 230\) km/h | \(\pm 5\) | \(\pm 5\) | \(\pm 11\) | \(\pm 16\) | \(\pm 18\) |
| Q2 | \(120 < V \leq 160\) km/h | – | – | – | – | – |
| Q3 | \(80 < V \leq 120\) km/h | – | – | – | – | – |
| Q4 | \(40 < V \leq 80\) km/h | – | – | – | – | – |
| Q5 | \(V \leq 40\) km/h | – | – | – | – | – |
Alignment defects may come from lining or tamping with poor input data, abrupt cant transitions, insufficient lateral ballast resistance, poor ballast shoulder condition or high internal rail forces. Poor alignment reduces ride comfort, increases lateral forces in fastenings and ballast, and accelerates uneven rail wear. The normal maintenance response is lining combined with tamping and ballast consolidation.
17.2.5 Cross-Level and Cant
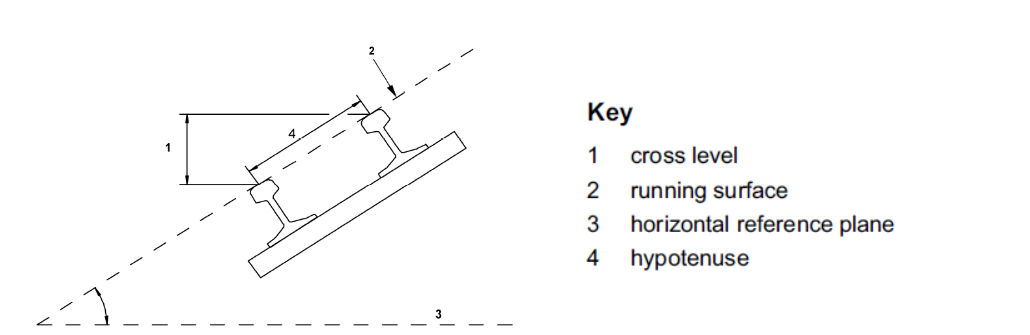
Cross-level is the height difference between the two rails at a cross-section. In maintenance data, the cross-level irregularity is the local deviation from the intended or mean cant value. Figure 17.17 shows the cross-section definition used in EN track-geometry terminology [92]. Local peaks and dips relative to the intended cant profile are the irregularities that enter the tolerance check.
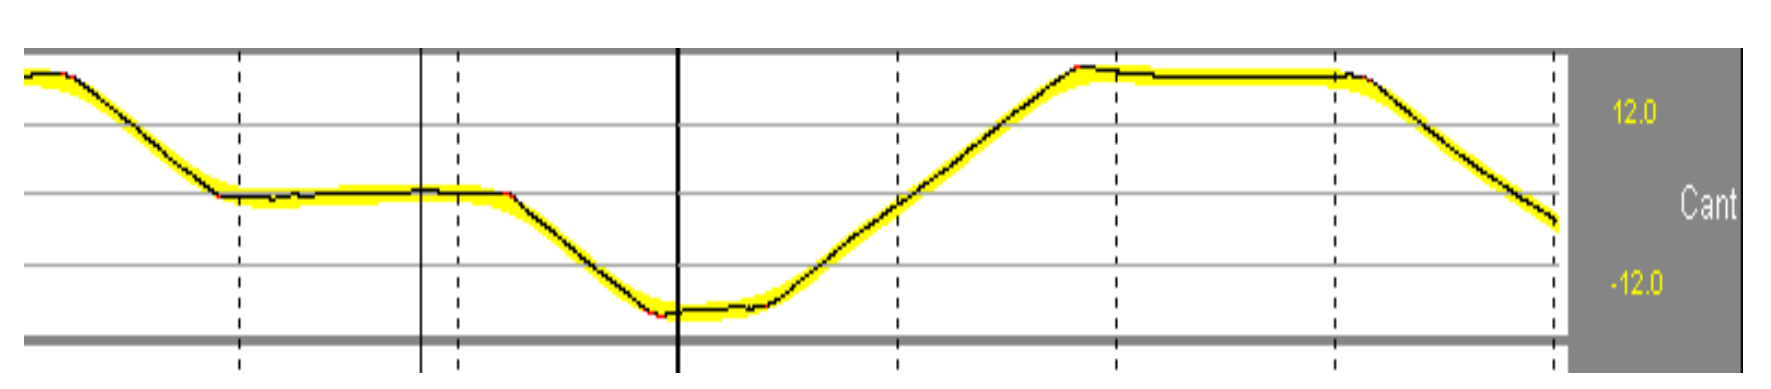
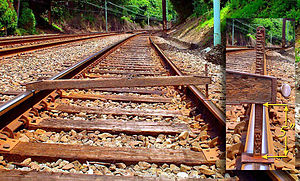
The original recording in Figure 17.18(a) labels cross-level as “Cant”. Its variation must be compared with the appropriate reference, not mistaken for a constant design cant. Figure 17.18(b) illustrates uneven support in the track. Construction errors, differential settlement and weak initial support can all change cross-level. A spirit-level or track-gauge check follows up the recording locally.
(a) Recorded cant
(b) Uneven rail support
| Class | Line speed | Newly adjusted | Maintenance | Action |
|---|---|---|---|---|
| Q0 | \(230 < V \leq 300\) km/h | \(\pm 3\) | \(\pm 6\) | \(\pm 8\) |
| Q1 | \(160 < V \leq 230\) km/h | \(\pm 3\) | \(\pm 6\) | \(\pm 8\) |
| Q2 | \(120 < V \leq 160\) km/h | \(\pm 4\) | \(\pm 6\) | \(\pm 9\) |
| Q3 | \(80 < V \leq 120\) km/h | \(\pm 4\) | \(\pm 8\) | \(\pm 11\) |
| Q4 | \(40 < V \leq 80\) km/h | \(\pm 5\) | \(\pm 10\) | \(\pm 13\) |
| Q5 | \(V \leq 40\) km/h | \(\pm 5\) | \(\pm 10\) | \(\pm 15\) |
Cross-level defects are commonly caused by poor construction quality, differential settlement, ballast voids, subgrade movement or an incorrect initial cant. They can be measured manually with a track gauge and level, or continuously by a measuring train. The usual remedy is tamping with controlled lifting of the low or high rail according to the design geometry.
17.2.5.1 Absolute Cant and Consequences
Cant is the same physical height difference between rails, but read as the intended superelevation on a curve. Figure 17.17 shows the cross-section definition: the rail running surface is compared with a horizontal reference plane, and the vertical leg is reported as cant or cross-level. For curved track, the absolute cant is controlled in addition to local cross-level irregularity.
| Line type | Action | Immediate |
|---|---|---|
| Mixed-traffic line | \(>150\) | 180 |
| Passenger line | \(>180\) | 190 |
Too much cant can overload the low rail or give poor behaviour for slow and freight trains; too little cant or high cant deficiency increases lateral wheel–rail forces. The maintenance decision therefore considers whether the local track is uneven and whether the curve geometry still matches the intended traffic speed and traffic mix.
17.2.6 Track Twist
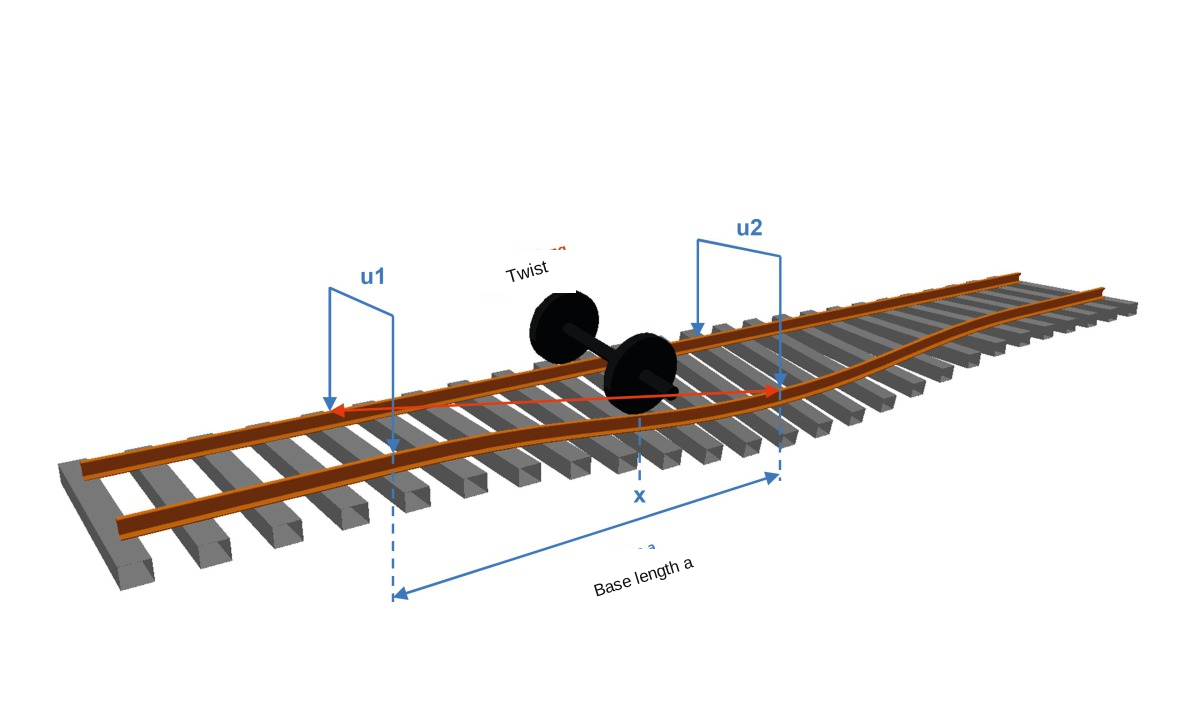
Track twist is the change in cross-level over a specified measuring base. Figure 17.19 shows why this is different from absolute cant: a track can have acceptable cant at each point but still change too rapidly between points. Bane NOR uses both 2 m and 9 m bases in the tolerance checks.
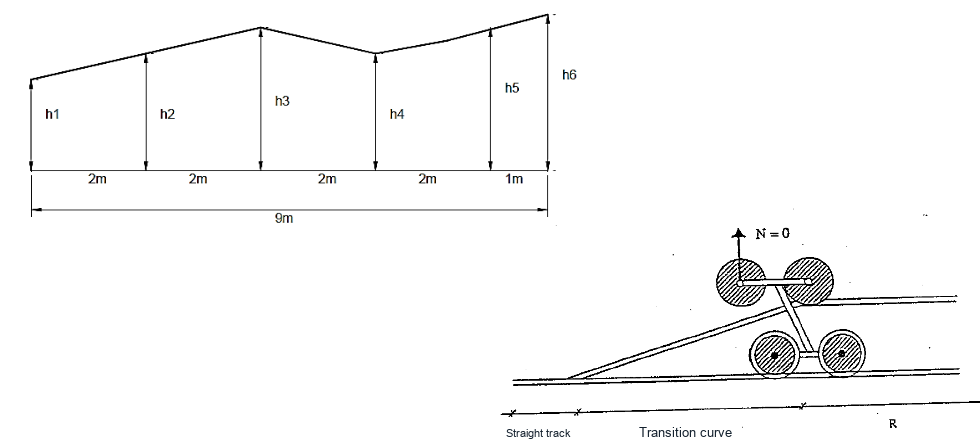
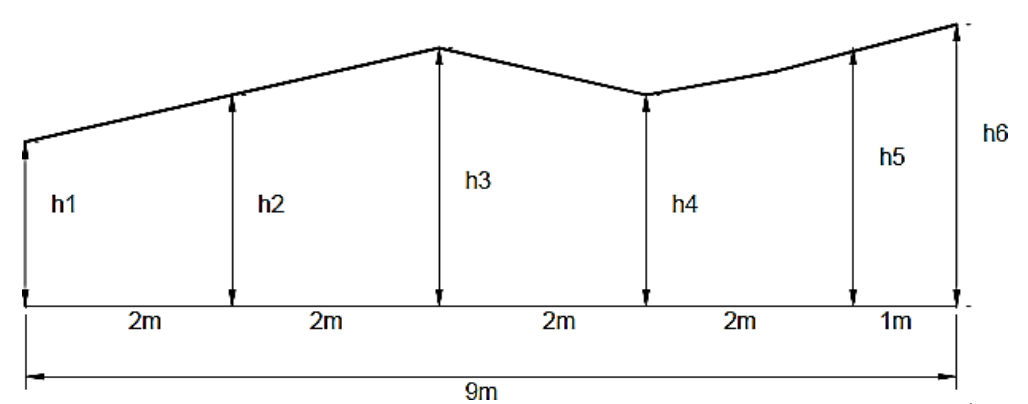
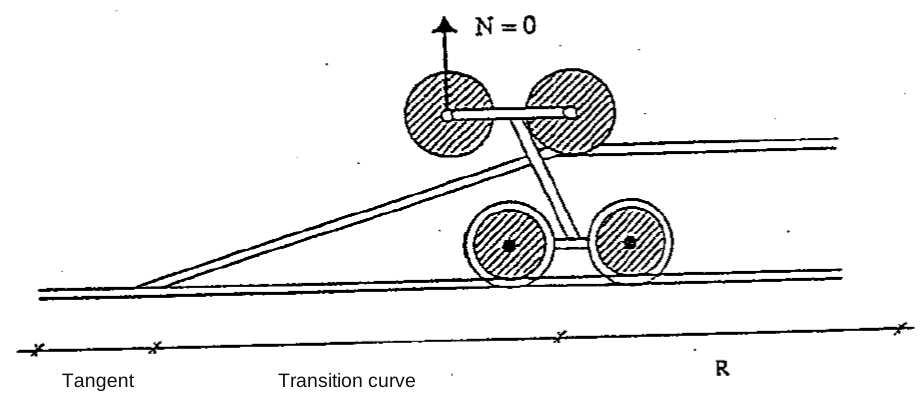
Figure 17.20(a) links cant readings to their spacing. In 17.20(b), the successive spacings 2 + 2 + 2 + 2 + 1 m give a total base of 9 m. The first four 2 m pairs and the 9 m endpoint pair can be assessed on their own bases; the final 1 m difference must not be compared directly with a 2 m limit. The sketch in 17.20(c) shows the wheel-unloading mechanism: N = 0 denotes loss of wheel load, and R denotes the curve radius.
Write the cant difference as \(\Delta h=h(x)-h(x-b)\) in millimetres. If \(b\) is in metres, the twist gradient \(g=\Delta h/b\) is in mm/m. The Bane NOR 2 m and 9 m tables below state cant differences in millimetres, so a gradient must be converted to the correct base before comparison.
(a) Cant change over the base
(b) The 2–2–2–2–1 m measurement layout
(c) Wheel unloading in a transition
| Class | Line speed | New | Newly adjusted | Maint. | Action | Imm. \(R \geq 400\) | Imm. \(R < 400\) |
|---|---|---|---|---|---|---|---|
| Q0 | \(230 < V \leq 300\) km/h | \(\pm 2\) | \(\pm 2\) | \(\pm 6\) | \(\pm 7\) | \(\pm 10\) | – |
| Q1 | \(160 < V \leq 230\) km/h | \(\pm 2\) | \(\pm 2\) | \(\pm 6\) | \(\pm 7\) | \(\pm 10\) | – |
| Q2 | \(120 < V \leq 160\) km/h | \(\pm 2\) | \(\pm 2\) | \(\pm 7\) | \(\pm 10\) | \(\pm 14\) | – |
| Q3 | \(80 < V \leq 120\) km/h | \(\pm 3\) | \(\pm 3\) | \(\pm 7\) | \(\pm 10\) | \(\pm 14\) | \(\pm 12\) |
| Q4 | \(40 < V \leq 80\) km/h | \(\pm 4\) | \(\pm 4\) | \(\pm 7\) | \(\pm 10\) | \(\pm 14\) | \(\pm 12\) |
| Q5 | \(V \leq 40\) km/h | \(\pm 5\) | \(\pm 5\) | \(\pm 7\) | \(\pm 10\) | \(\pm 14\) | \(\pm 12\) |
| Class | Line speed | New | Newly adjusted | Maint. | Action | Imm. \(R \geq 400\) | Imm. \(R < 400\) |
|---|---|---|---|---|---|---|---|
| Q0 | \(230 < V \leq 300\) km/h | \(\pm 6\) | \(\pm 6\) | \(\pm 24\) | \(\pm 31\) | \(\pm 43\) | – |
| Q1 | \(160 < V \leq 230\) km/h | \(\pm 6\) | \(\pm 6\) | \(\pm 24\) | \(\pm 31\) | \(\pm 43\) | – |
| Q2 | \(120 < V \leq 160\) km/h | \(\pm 6\) | \(\pm 6\) | \(\pm 24\) | \(\pm 31\) | \(\pm 43\) | – |
| Q3 | \(80 < V \leq 120\) km/h | \(\pm 6\) | \(\pm 6\) | \(\pm 24\) | \(\pm 31\) | \(\pm 43\) | \(\pm 34\) |
| Q4 | \(40 < V \leq 80\) km/h | \(\pm 9\) | \(\pm 9\) | \(\pm 24\) | \(\pm 31\) | \(\pm 43\) | \(\pm 34\) |
| Q5 | \(V \leq 40\) km/h | \(\pm 15\) | \(\pm 15\) | \(\pm 24\) | \(\pm 31\) | \(\pm 43\) | \(\pm 34\) |
For unloaded track, Bane NOR requires twist to remain within the action limit [50]; that limit therefore acts as the immediate limit. In a cant ramp, the action-limit check includes both intended ramp twist and unintended deviations. The newly adjusted-track limit applies to unintended deviations from the intended ramp.
Twist is safety-critical because it can unload one wheel, especially for torsionally stiff vehicles. It may be caused by local settlement, frost heave, isolated ballast pockets, construction work or an abrupt cant ramp in transition geometry. Measuring trains detect twist continuously, while local checks can be made manually over the prescribed bases. The maintenance response is usually tamping or manual packing to restore the cross-level sequence; if excess ballast has created a local high point, ballast removal may be needed before the track is handed back.
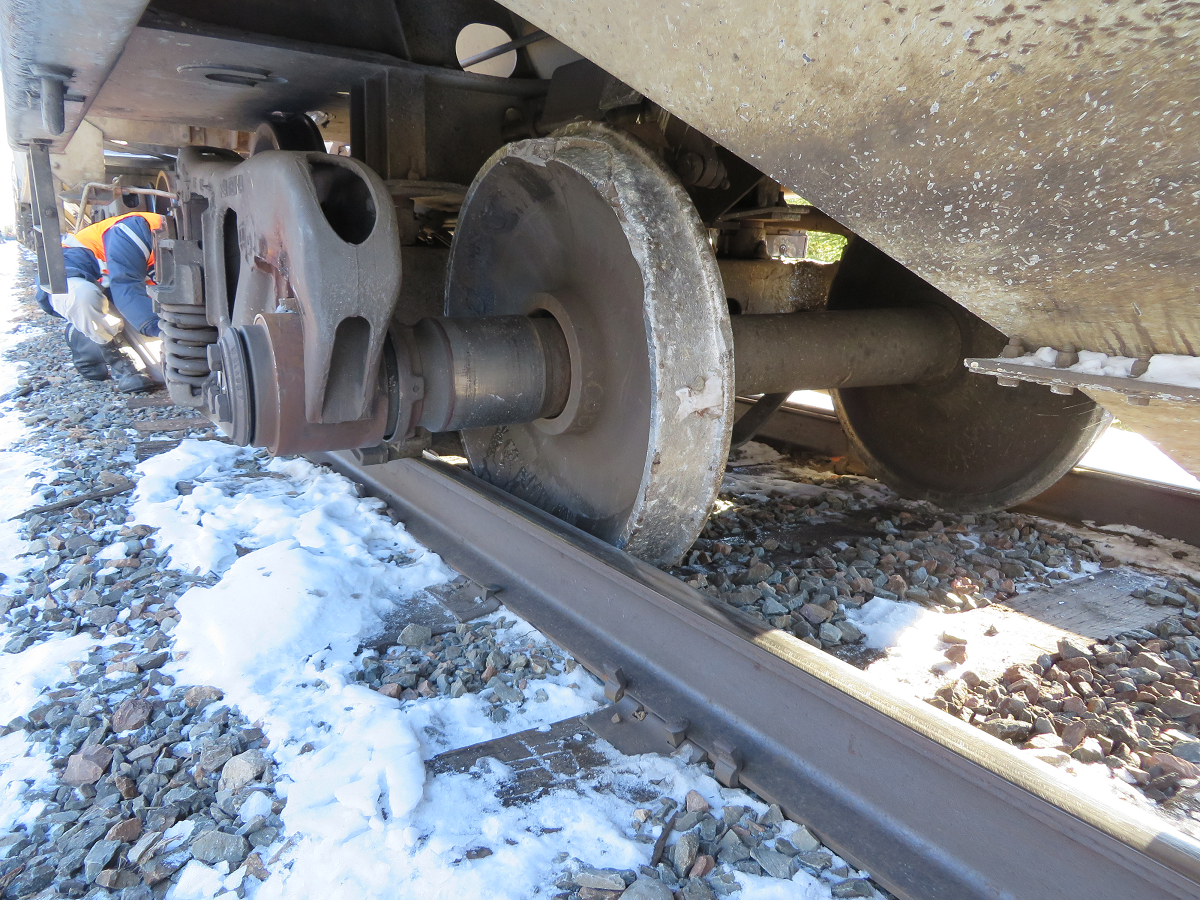
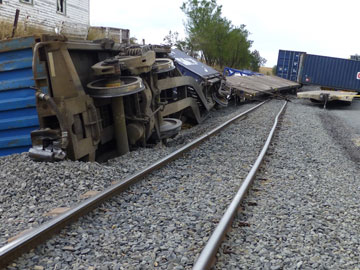
Figure 17.21 illustrates the potential severity of derailment. Its use beside the twist discussion does not establish the cause of this particular accident. The engineering link is the loss of wheel load in the preceding sketch, which can increase flange-climbing risk. Repair must remove the geometry defect and its support-related cause, and the corrected track must be checked before return to service.
17.3 Track Inspection
Track inspection is the input side of maintenance planning. It converts observations and measurements into decisions: continue monitoring, plan tamping or grinding, repair a component, impose a restriction, or prepare a renewal. Chapter 5, Section 5.2, introduced the measuring vehicles and sensor systems, and Chapter 4 described the defect types feeding the inspection process. This section focuses on how inspection results are used by the maintenance engineer.
Walking inspection is used to find visible defects and local conditions that are difficult to judge from a measurement trace alone: broken sleepers, missing or loose fastenings, ballast shoulder loss, blocked drainage, vegetation, mud pumping, rail-surface damage and poor local access conditions.
Figure 17.22 links a field measurement to the track component and its digital record. The observation must retain its location and component identity if it is to support follow-up inspection or a maintenance order.
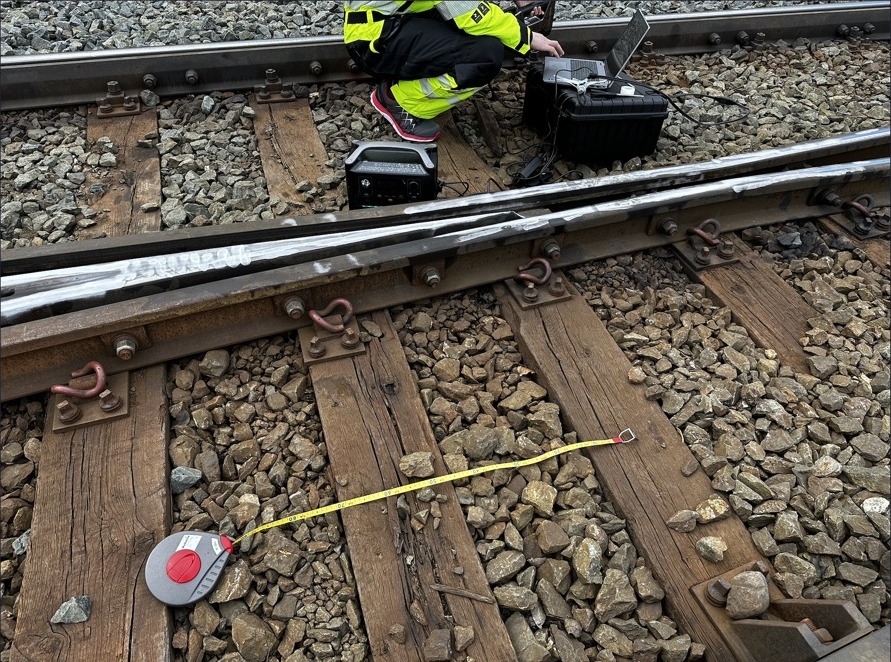
Rail-flaw testing checks whether the rail contains internal or surface-breaking defects that require repair, closer monitoring or rail replacement. The maintenance decision is based on defect type, defect size, rail stress state, traffic load and the time available before the next safe work possession.
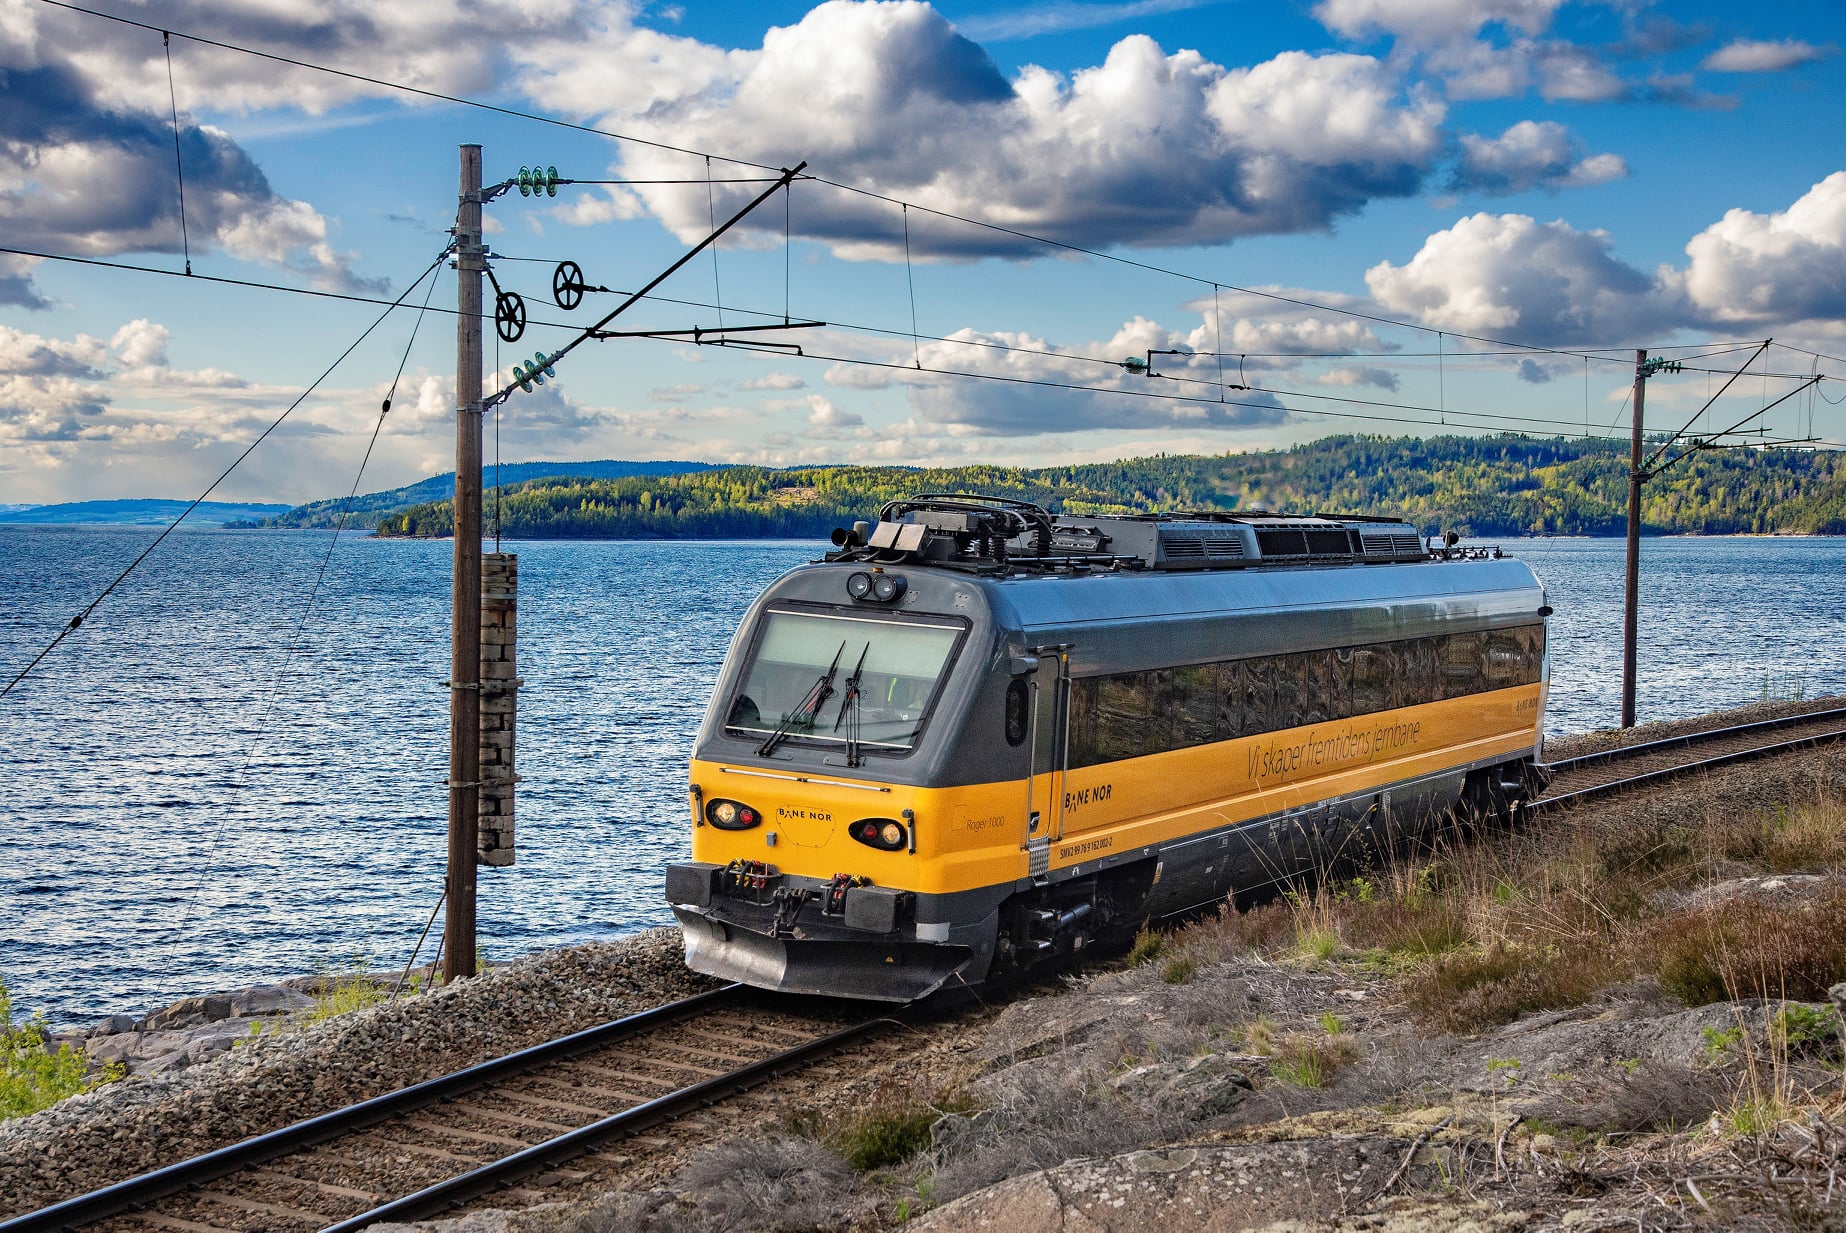
Diagnostic geometry measurement provides the measured parameters used in Section 17.2: gauge, longitudinal level, horizontal alignment, cross-level/cant and twist. The outputs are compared with the maintenance, action and immediate limits in the technical regulations. A diagnostic train such as ROGER 1000 was therefore introduced in Chapter 5 as a measuring vehicle; in this chapter it matters as the source of the maintenance work list.
Inspection frequency is line-class and risk dependent. The practical principle is that high-speed, high-tonnage and safety-critical sections are inspected more often than lightly trafficked secondary lines. The maintenance engineer then combines the latest inspection results with degradation trend, traffic consequence and possession availability before choosing the intervention.
17.3.1 Inspection Role and Recording Vehicle
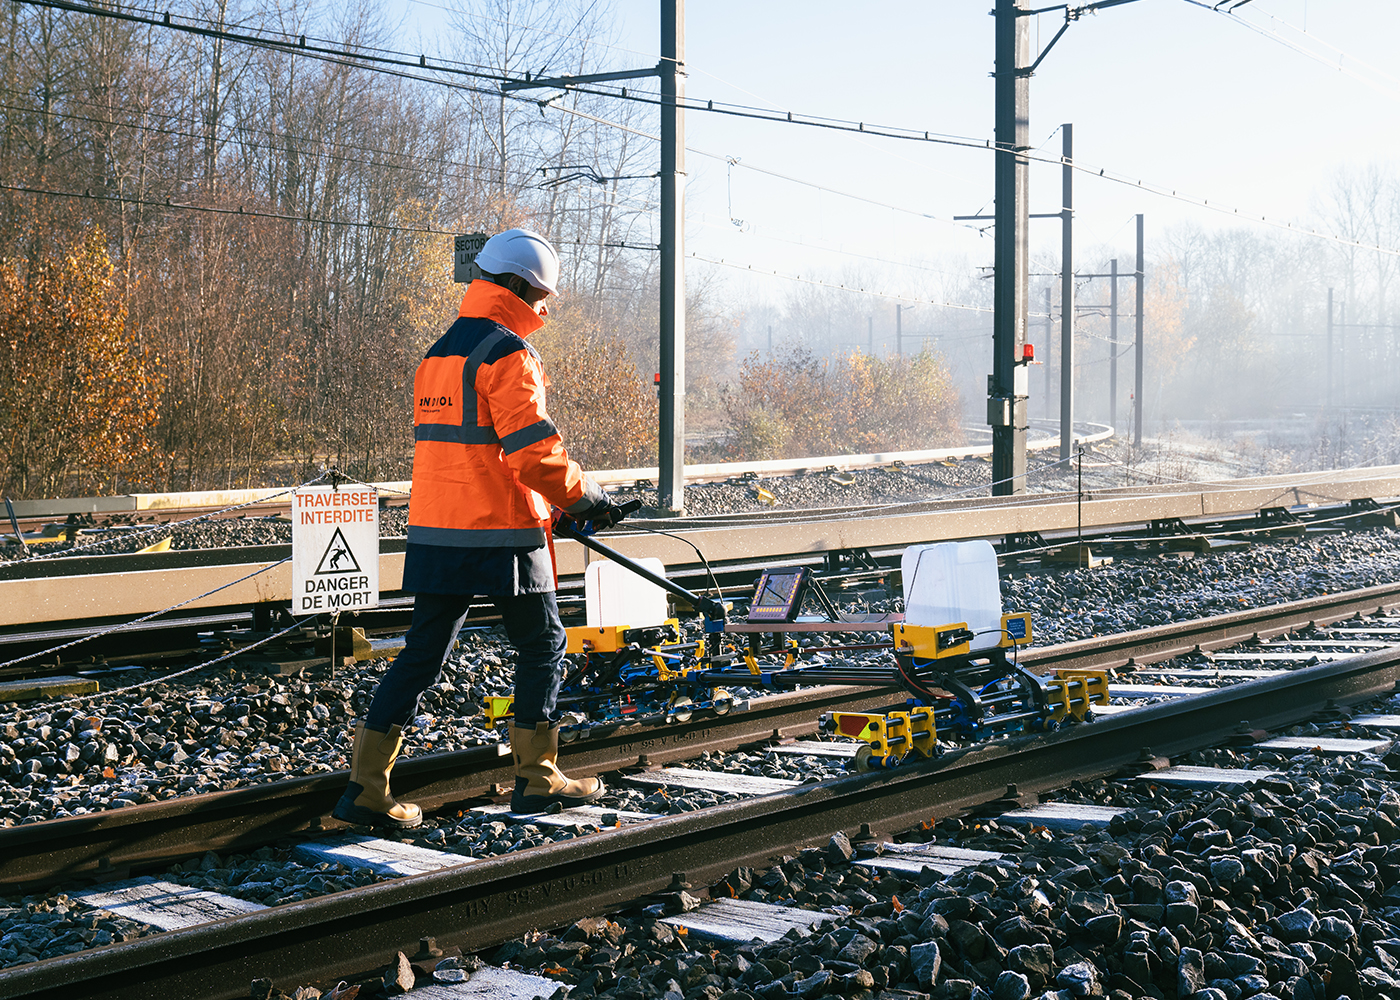
Inspection establishes the condition, identifies where and when repair is needed, and verifies the completed work. Figure 17.23(a) shows ROGER 1000, the vehicle used in the lecture example; 17.23(b) shows local measurement. The recording vehicle combines optical geometry measurements and inertial sensors such as accelerometers, gyroscopes and inclinometers. The lecture describes 160 km/h self-propelled operation and geometry sampling at 0.5 m intervals. This supplies closely spaced observations, not an assurance that every defect has been detected. Field inspection and rail-flaw testing remain complementary.
(a) ROGER 1000
(b) Local inspection and measurement
17.3.2 Measurement Records and Follow-Up
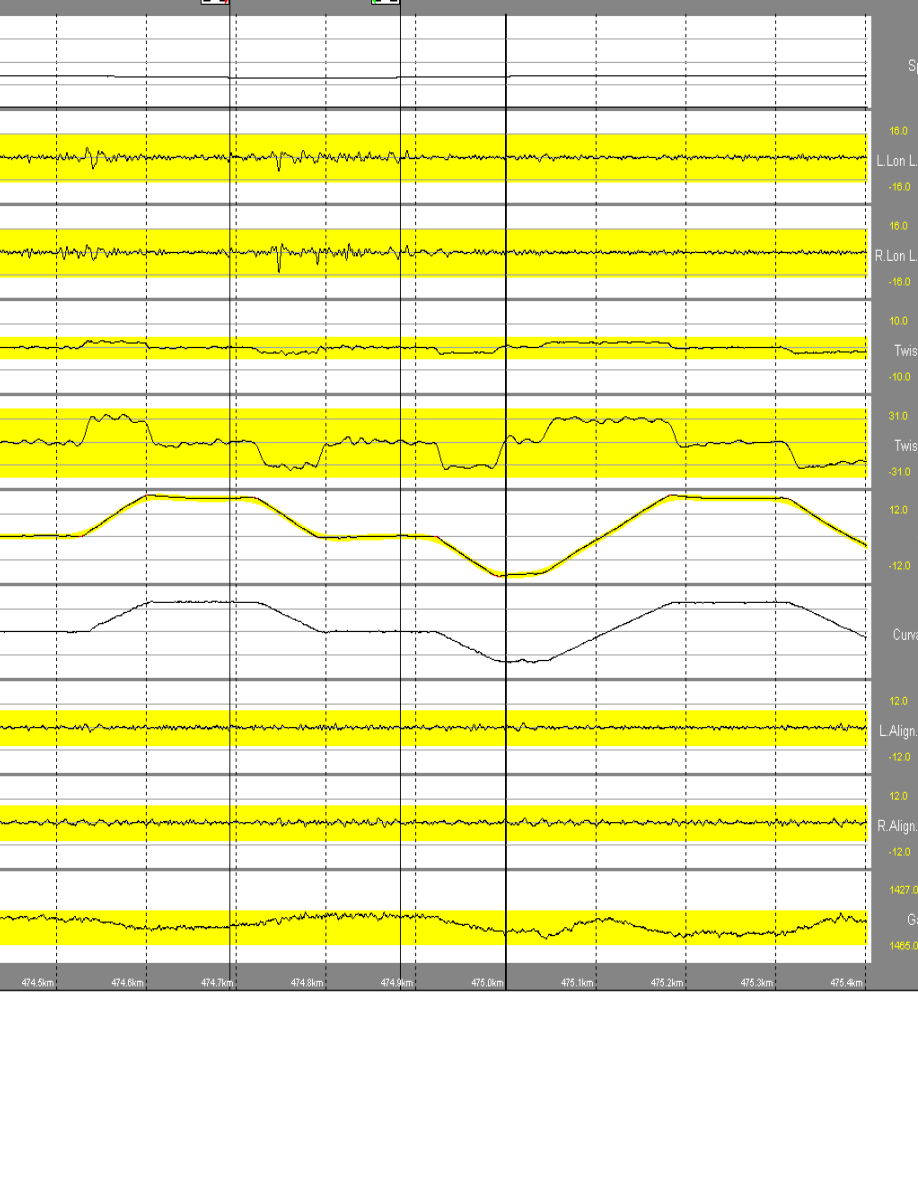
The original record in Figure 17.24 places multiple measurements on a common distance axis. Read a suspected defect against neighbouring signals, then retain its location, type, magnitude and length in the work list. Recording output includes parameter diagrams, critical-defect lists and quality summaries. The lecture also describes overhead-line monitoring, short-wave rail-head measurements and photographic documentation at 20 m intervals. Those outputs answer different questions and must be associated with the same location. Comparing successive runs and checking the repaired site completes the inspection loop.
17.3.3 Inspection Frequency
Set the frequency through the applicable preventive-maintenance programme and generic work routines, taking account of line speed, traffic loading, the systems being monitored and the consequence of failure. Increase follow-up when degradation, weather or recent work reduces the margin to an intervention limit. The old speed-only K0–K5 frequency table marked “Outdated” in the lecture is not a current inspection schedule. Keep geometry quality classes Q0–Q5 separate from the quality number K.
17.3.4 Track Quality Index and K-Number Calculation
Instead of evaluating individual defects in isolation, infrastructure managers also use section-based quality indicators. In the international literature, Track Quality Index (TQI) is not one universal formula: most versions combine statistical features of measured track-geometry signals, especially standard deviations over a defined section length. Bane NOR's operational quality measure is the K-number, which expresses how large a share of the section has all standard-deviation values within the quality limits [17, 100, 50].
For one geometry parameter \(x\), measured at \(n\) points in a calculation window, the mean and sample standard deviation (for \(n>1\)) are
Here \(x_i\) is a measured deviation in millimetres, for example longitudinal level or horizontal alignment. Under the Bane NOR assessment method, these standard deviations are normally calculated over 200 m or 1000 m sections; assessment diagrams use a moving 200 m basis and report K- and Q-values for each full kilometre [17].
Figure 17.25 shows two geometry signals with a similar mean but different roughness. The darker trace has the larger standard deviation. Compare signals over the same assessment length and wavelength band: a section average alone can hide substantial local variation.
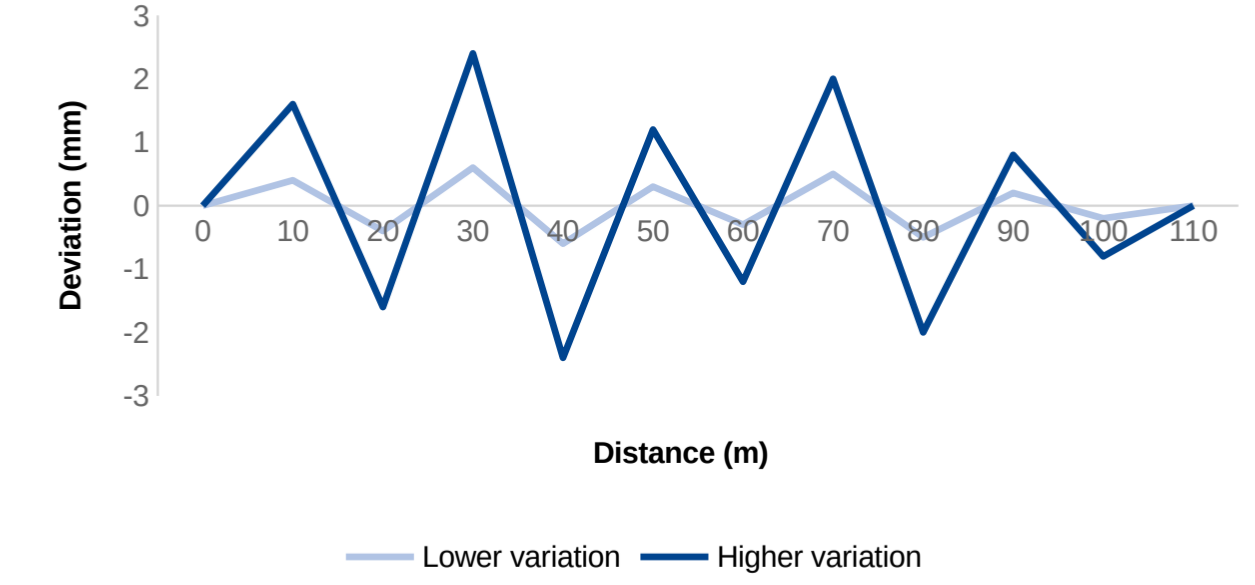
Bane NOR's quality table uses the following standard-deviation checks:
Bane NOR describes interaction as a vector combination of horizontal geometry and cant [50], obtained from the measuring train. Its standard deviation must be taken from the approved measurement processing. The two marginal standard deviations alone do not define the combined signal. For example, if a linear combination is defined as \(S=c_RR+c_PP\), its variance is
Only for unit coefficients and zero covariance does this reduce to a root-sum-square. We use \(\sigma_{RP}^{*}=\sqrt{\sigma_R^2+\sigma_P^2}\) below as an illustrative comparison indicator, not as the prescribed Bane NOR interaction calculation. Generic TQI methods also combine standard deviations as a weighted sum or a combined measure,
where \(m\) is the number of included parameters and \(w_j\) is the weight assigned to parameter \(j\); the parameter set and aggregation length are railway-specific. These generic forms are useful for comparing concepts, but the maintenance decision in this chapter should use the Bane NOR K-number and quality limits in Tables 17.13 and 17.14.
For a section of length \(L\) partitioned into \(N\) non-overlapping accounting intervals, let \(\ell_{\mathrm{OK},r}\) be the length within interval \(r\) for which all relevant \(\sigma\)-values satisfy the quality limits. Define the total compliant length and the K-number as
| Class | Line speed | \(\boldsymbol{\sigma_H}\) vertical | \(\boldsymbol{\sigma_R}\) cant | \(\boldsymbol{\sigma_P}\) horizontal | \(\boldsymbol{\sigma_S}\) interaction |
|---|---|---|---|---|---|
| Q0 | \(230 < V \leq 300\) km/h | 0.85 | 0.90 | 0.50 | 1.60 |
| Q1 | \(160 < V \leq 230\) km/h | 1.15 | 1.00 | 0.70 | 1.70 |
| Q2 | \(120 < V \leq 160\) km/h | 1.40 | 1.20 | 0.75 | 1.90 |
| Q3 | \(80 < V \leq 120\) km/h | 1.80 | 1.40 | 1.05 | 2.40 |
| Q4 | \(40 < V \leq 80\) km/h | 2.75 | 1.80 | 1.95 | 3.10 |
| Q5 | \(V \leq 40\) km/h | 2.75 | 2.20 | 1.95 | 3.60 |
| Class | Line speed | Newly adjusted | Maintenance | Action |
|---|---|---|---|---|
| Q0 | \(230 < V \leq 300\) km/h | 90 | 90 | 80 |
| Q1 | \(160 < V \leq 230\) km/h | 90 | 90 | 75 |
| Q2 | \(120 < V \leq 160\) km/h | 90 | 90 | 50 |
| Q3 | \(80 < V \leq 120\) km/h | 90 | 80 | 30 |
| Q4 | \(40 < V \leq 80\) km/h | 90 | 75 | 20 |
| Q5 | \(V \leq 40\) km/h | – | – | – |
17.3.4.1 Worked Example: TQI and K-Number
Consider a 1000 m Q2 section divided into five 200 m assessment windows: 0–200, 200–400, 400–600, 600–800 and 800–1000 m. Table 17.15 gives illustrative measurement data. The detailed calculation below is for the 400–600 m window only; it is a 200 m window located between chainage 400 m and 600 m.
| Assessment window | \(\boldsymbol{\sigma_H}\) | \(\boldsymbol{\sigma_R}\) | \(\boldsymbol{\sigma_P}\) | \(\boldsymbol{\sigma_S}\) |
|---|---|---|---|---|
| 0–200 m | 1.10 | 0.80 | 0.50 | 0.94 |
| 200–400 m | 1.35 | 1.05 | 0.70 | 1.26 |
| 400–600 m | 1.70 | 1.40 | 0.90 | 1.66 |
| 600–800 m | 1.20 | 1.10 | 0.72 | 1.31 |
| 800–1000 m | 1.30 | 0.90 | 0.60 | 1.08 |
The table supplies all four quantities, including \(\sigma_S\), as illustrative measurement results. The separate root-sum-square comparison indicator is
For the 400–600 m window in Table 17.15,
For these chosen data, the indicator happens to equal the supplied \(\sigma_S\) after rounding. This equality is not assumed for real measurements. The five fixed 200 m windows simplify the exercise; operational assessment uses the prescribed moving-window processing.
To illustrate how a generic TQI can be calculated from the same values, use the Q2 limits in Table 17.13 as denominators in an equal-weight, normalised comparison index:
For the 400–600 m window this gives
This normalised TQI is useful for ranking roughness, but the Bane NOR K-number decision is stricter: a 200 m window is counted as OK only when all four standard-deviation checks satisfy the Q2 limits.
| Window | \(\boldsymbol{\sigma_H}\) | \(\boldsymbol{\sigma_R}\) | \(\boldsymbol{\sigma_P}\) | \(\boldsymbol{\sigma_S}\) | \(\boldsymbol{\mathrm{TQI}_{\mathrm{norm}}}\) | OK length |
|---|---|---|---|---|---|---|
| 0–200 m | 1.10 | 0.80 | 0.50 | 0.94 | 0.65 | 200 m |
| 200–400 m | 1.35 | 1.05 | 0.70 | 1.26 | 0.86 | 200 m |
| 400–600 m | 1.70 | 1.40 | 0.90 | 1.66 | 1.11 | 0 m |
| 600–800 m | 1.20 | 1.10 | 0.72 | 1.31 | 0.86 | 200 m |
| 800–1000 m | 1.30 | 0.90 | 0.60 | 1.08 | 0.76 | 200 m |
The 400–600 m window is not OK because \(\sigma_H=1.70>1.40\), \(\sigma_R=1.40>1.20\), and \(\sigma_P=0.90>0.75\), even though the interaction value \(\sigma_S=1.66\) remains below 1.90. The OK length is therefore
The K-number for the 1000 m section is
For a Q2 line this is below the maintenance limit of 90, but above the action limit of 50. The section should therefore enter root-cause investigation and planned tamping or renewal assessment before the quality drops into the action range. In this example, the failed window also has the highest normalised TQI, so it is the first 200 m part of the kilometre to inspect in the field.
17.3.5 Position Checks and Overall Condition
The five geometry parameters describe relative track geometry. The quality number gives a section-level summary, while absolute position checks compare the track with its intended location in an external reference system. Assess these together with component condition and service performance. A high K-number does not certify every sleeper, fastening, drainage asset or absolute track position. The following tables retain the position checks used in the chapter.
| Class | Line speed | Newly adjusted | Maintenance |
|---|---|---|---|
| Q0–Q1 | \(160 < V \leq 300\) km/h | +10/-20 | +20/-30 |
| Q2–Q5 | \(V \leq 160\) km/h | +30/-40 | +50/-75 |
| Class | Line speed | Curve radius | Newly adjusted | Maintenance |
|---|---|---|---|---|
| Q0–Q1 | \(160 < V \leq 300\) km/h | – | \(\pm 20\) | \(\pm 30\) |
| Q2–Q5 | \(V \leq 160\) km/h | \(R>1000\) m | \(\pm 40\) | \(\pm 60\) |
| Q2–Q5 | \(V \leq 160\) km/h | \(750<R\leq1000\) m | \(\pm 40\) | \(\pm 40\) |
| Q2–Q5 | \(V \leq 160\) km/h | \(500<R\leq750\) m | \(\pm 30\) | \(\pm 30\) |
| Q2–Q5 | \(V \leq 160\) km/h | \(350<R\leq500\) m | \(\pm 20\) | \(\pm 20\) |
| Q2–Q5 | \(V \leq 160\) km/h | \(R\leq350\) m | \(\pm 15\) | \(\pm 15\) |
17.4 Track Maintenance
The lecture moves from assessment to intervention: approximate cycles, tamping, grinding, ballast cleaning, component replacement and operational challenges. Select each task from the measured defect and its cause, then plan resources, possession and verification.
17.4.1 Approximate Maintenance Cycles
Table 17.19 gives indicative maintenance and renewal cycles from railway maintenance literature for an intensively operated main line. The two columns give independent illustrative ranges from different operating conditions. They are not conversions of one another at a common annual tonnage and should not be read as Bane NOR limit values. Grinding is the most frequent intervention (every 1–3 years); subsoil rehabilitation is the least frequent (typically longer than 40 years).
| Maintenance type | Passage [MGT] | Typical duration [years] |
|---|---|---|
| Tamping | 40–70 | 4–5 |
| Grinding | 20–30 | 1–3 |
| Ballast cleaning | 150–300 | 12–15 |
| Rail replacement | 300–1000 | 10–15 |
| Wooden sleeper replacement | 250–600 | 20–30 |
| Concrete sleeper replacement | 350–700 | 30–40 |
| Rail fastenings | 100–500 | 10–30 |
| Ballast replacement | 200–500 | 20–30 |
| Subsoil rehabilitation | \(>500\) | \(>40\) |
Whole-life cost analysis (LCC, Life Cycle Cost) provides the framework for comparing maintenance strategies. For a given track section, the LCC model calculates the net present value of all future maintenance and renewal costs under different intervention strategies. The strategy with the lowest LCC, subject to safety and service constraints, is selected.
17.4.2 Tamping and Stabilisation
Tamping is the normal maintenance response when poor vertical level, alignment or cross-level is still caused mainly by sleeper support and ballast packing rather than by life-expired components. Tamping machines lift and line the track and pack ballast under the sleepers; the machinery and tamping sequence were described earlier in Chapter 5, Section 5.4, especially Figure 5.9. In this chapter the maintenance question is when tamping is the right intervention.
Tamping is suitable when the geometry defect is moderate, the ballast can still provide stable support after re-packing, and the corrected geometry will remain within limits until the next inspection. It is less suitable when the same location deteriorates rapidly after each pass. In that case the root cause may be fouled ballast, poor drainage, weak formation, rail-seat deterioration, sleeper damage or an unresolved transition-zone problem.
After tamping, the disturbed ballast is initially less stable than undisturbed ballast, and a short settlement period follows before re-consolidation. Traffic loading, dynamic track stabilisation and shoulder compaction can help restore stability after track work; where the required conditions are not yet documented, temporary speed restrictions may be needed [6].
Each tamping pass also crushes some ballast particles. Repeated tamping therefore has a maintenance cost beyond the possession itself: it shortens the remaining ballast life. When geometry correction no longer lasts, tamping should be replaced by drainage repair, ballast cleaning, ballast renewal or a more extensive track renewal decision.
The unit in Figure 17.26(a) works around the sleepers; the principle in 17.26(b) is the subsequent stabilisation step. Vertical loading and horizontal vibration compact the disturbed ballast structure. The lecture quotes a possible reduction in resistance of up to 40% after disturbance. This is an illustrative sensitivity, not a universal design factor or an automatic hand-back rule. The required stability, ballast profile, temperature controls and any traffic restrictions must be checked for the actual work.
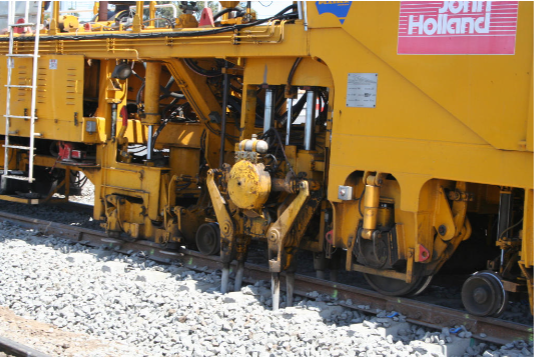
(a) Tamping unit
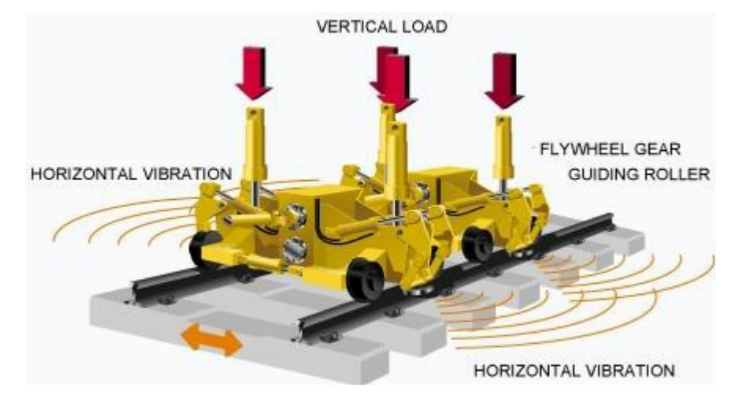
(b) Dynamic stabilisation
17.4.3 Rail Grinding
Rail grinding removes material from the rail head to achieve two goals [68, 130]:
Preventive grinding removes the shallow surface layer (typically 0.1–0.3 mm) in which rolling contact fatigue (RCF) cracks initiate, before they penetrate to the dangerous depth (typically 3–5 mm). By removing this layer at regular intervals, rail service life can be extended substantially compared with a purely corrective strategy.
Corrective grinding removes existing cracks and restores the rail head profile. It requires deeper material removal (0.3–1.0 mm or more) and must be completed before cracks reach a depth requiring rail replacement.
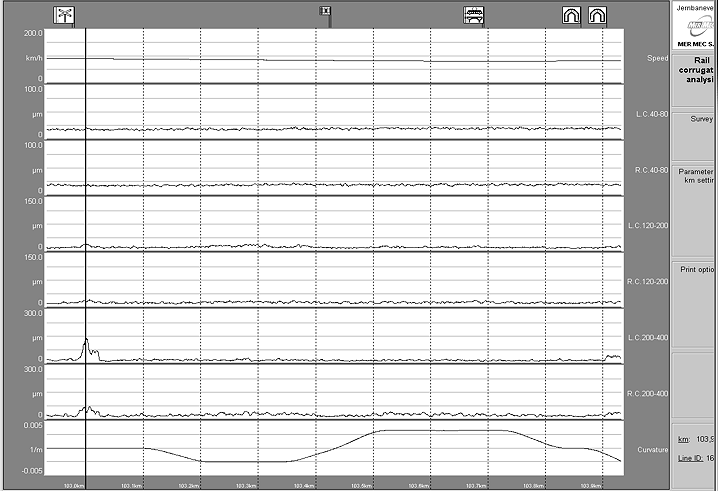
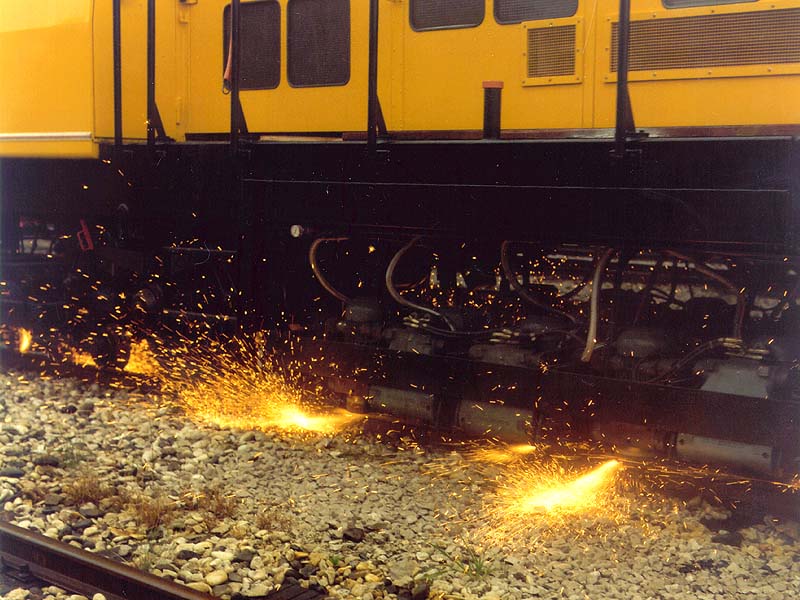
Figure 17.27 shows the practical result of grinding in measured rail-corrugation output: the rougher trace before treatment is replaced by a much smoother trace after treatment. The grinding and milling machines themselves were described earlier in Chapter 5, Section 5.3; here the important point is the maintenance strategy and timing of the intervention.
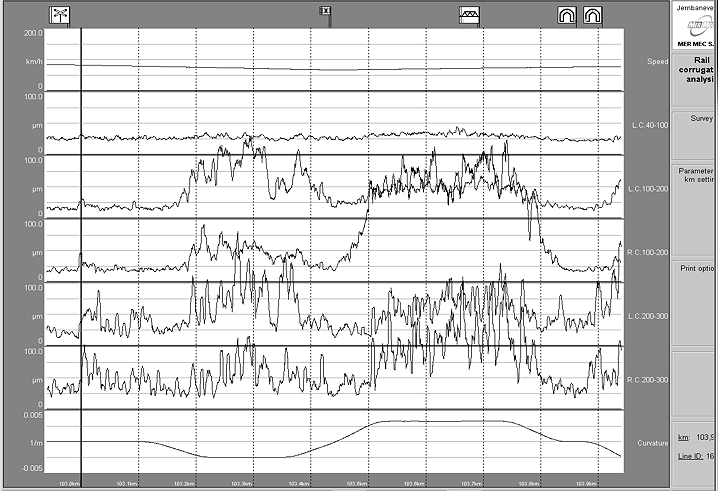
(a) Before grinding
(b) After grinding
(c) Grinding operation
Grinding must be planned together with rail-profile measurements, rail-flaw information, noise or corrugation complaints, curve radius and traffic load. A preventive programme normally removes little metal per visit but repeats the work before cracks become deep. A corrective programme removes more metal, takes longer and consumes more of the rail head. The maintenance decision is therefore a balance between present defect removal and future rail life.
Compare matching channels in 17.27(a) and 17.27(b): the rail-surface signal is much smoother after treatment. The photograph in 17.27(c) shows material removal during the operation. These original software records retain their axes and channel labels so the measurement evidence is not replaced by an illustrative curve.
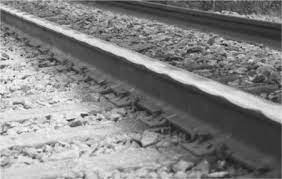
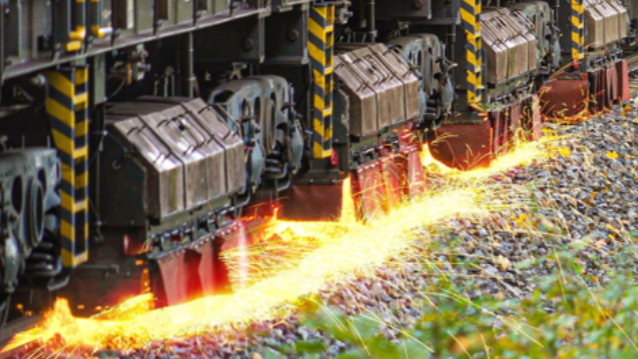
Figure 17.28(a) shows the surface irregularity treated by the machine in 17.28(b). The lecture distinguishes micro-waves (30–80 mm), short waves (80–300 mm) and long waves (300–3000 mm), with example maximum depths of 0.5, 1.2 and 5.0 mm respectively. Those are the lecture’s defect examples, not a prescribed grinding-removal depth. Reducing roughness can lower dynamic loads, noise and vibration and reduce damage elsewhere in the track. A deep defect still needs a rail-flaw and residual-section assessment before a removal method is chosen.
(a) Rail-surface corrugation
(b) Grinding machine
17.4.4 Ballast Cleaning and Renewal
As described in Chapter 3, ballast progressively fouls from particle breakdown, sleeper wear and subgrade pumping. Contamination impairs drainage and load distribution. A numerical fouling criterion needs a specified sieve and sampling method; the lecture’s 22.4 mm sieve example is explained below.
Preventive ballast care aims to delay both crushing and contamination. Practical measures include using durable crushed rock, providing sufficient ballast depth below the sleeper, using under-sleeper pads where support is very stiff, keeping drainage open, avoiding unnecessary repeated tamping, preventing ore or freight leakage onto the track, controlling vegetation that drops organic material into the ballast, and ensuring that maintenance work does not introduce soil or fines into the ballast bed.
Ballast cleaning is selected when the coarse ballast can still be reused, but fines have reduced drainage and support. The maintenance objective is to remove the fouled fraction, restore drainage, add fresh ballast where needed, tamp the track and return the section to stable geometry. The ballast-cleaning machines and the excavation/screening workflow were described earlier in Chapter 5, Section 5.5.
Full ballast replacement is selected when cleaning is no longer economical or technically sufficient. Typical triggers are heavily rounded or crushed ballast, recurring mud pumping, poor formation condition, repeated loss of geometry after tamping, or a renewal possession where sleepers and rails are replaced at the same time. Renewal trains and sleeper replacement systems were introduced as machinery in Chapter 5, Section 5.6; in this chapter they are part of the maintenance decision about when local repair should become renewal.
Figure 17.29(a) shows the cleaning machine. The three cases in 17.29(b) compare sufficient clean ballast, insufficient ballast thickness and fouled ballast: cleaning only helps if depth, drainage and formation condition are also adequate. In 17.29(c), the excavation chain lifts material to the screening and conveyor system. The lecture describes excavation at least 25 cm below the sleeper and a screening example removing particles smaller than 35 mm before coarse material returns to the track. The sampling sieve used to assess fouling and the machine’s separation screen serve different purposes.
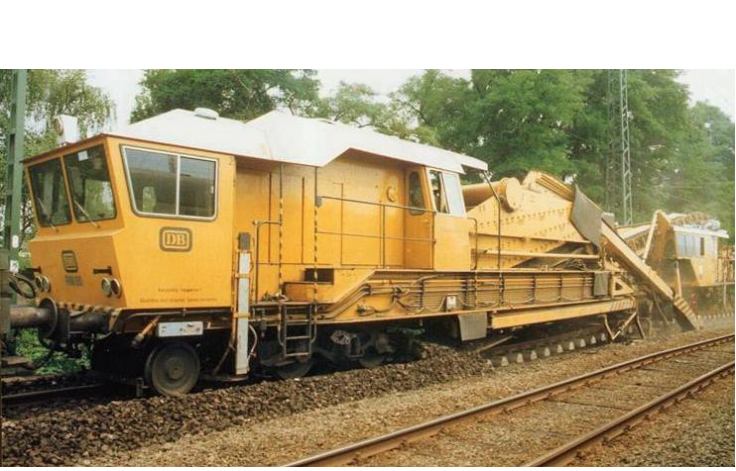
(a) Ballast-cleaning machine
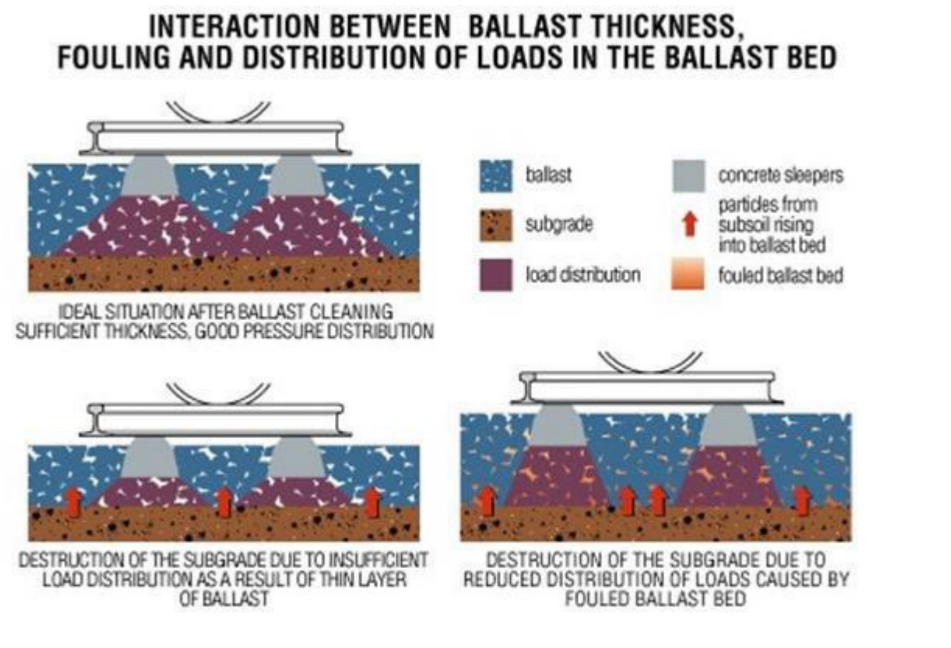
(b) Clean, thin and fouled ballast cases

(c) Excavation and conveyor layout
The conveyor wagons in Figure 17.30(a) move spoil through the work train and provide a buffer while loaded wagons leave for disposal. Wagon capacity, transport time and available disposal access can govern output even when the cleaner has spare capacity. The lecture quotes about 1.5 t of dirty ballast per metre, machine capacity up to 1000 m³/h and hopper capacities of 65–100 t as equipment examples, not guaranteed site productivity.
Figure 17.30(b) retains the original 32/50 grading plot. Its blue zone marks a cleaning criterion based on the proportion passing the 22.4 mm rectangular sieve. The lecture identifies more than 30% as a cleaning trigger and more than 40% as requiring action. These percentages refer to that stated test, not to an unspecified “fines percentage”. Record the sieve, sampling and mass basis before comparing a sample with the criterion, and verify the applicable project requirements.
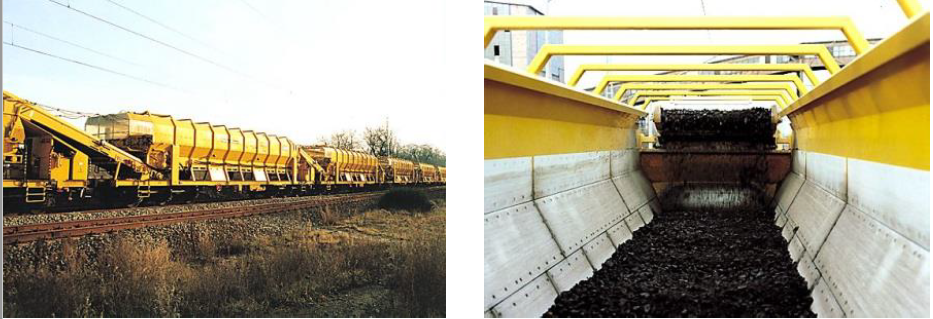
(a) Conveyor hopper wagons
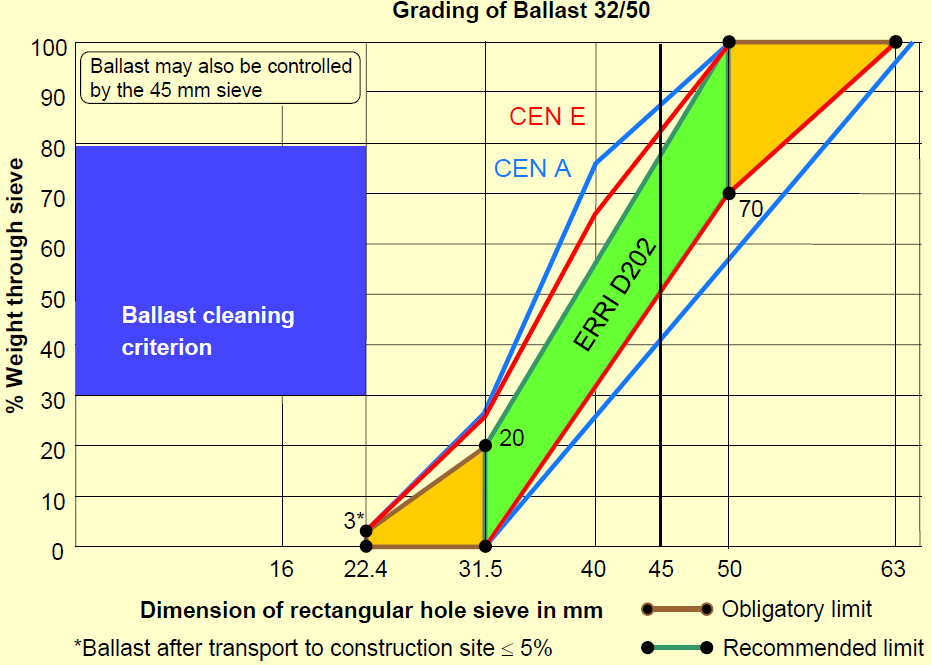
(b) Grading and cleaning criterion
17.4.5 Component Replacement
Figure 17.31(a) shows missing fastening components. Without adequate restraint the rail can move and gauge can change under load. The displaced pad and sleeper-support problem in 17.31(b) and the missing insulation or pad-position fault in 17.31(c) affect the rail seat and cannot be solved simply by correcting the visible alignment. The ballast loss at the culvert in 17.31(d) calls for a support and drainage check before reinstatement. Record the component, extent, neighbouring condition and functional consequence before deciding between local replacement and wider renewal.
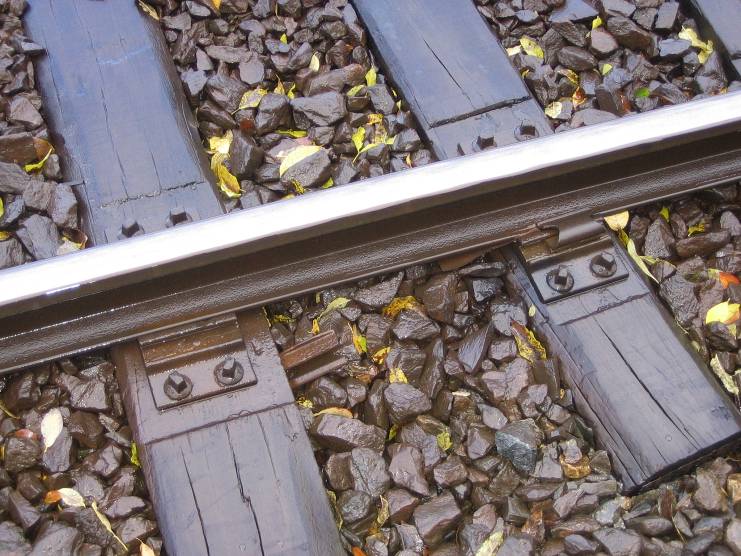
(a) Missing fastening components
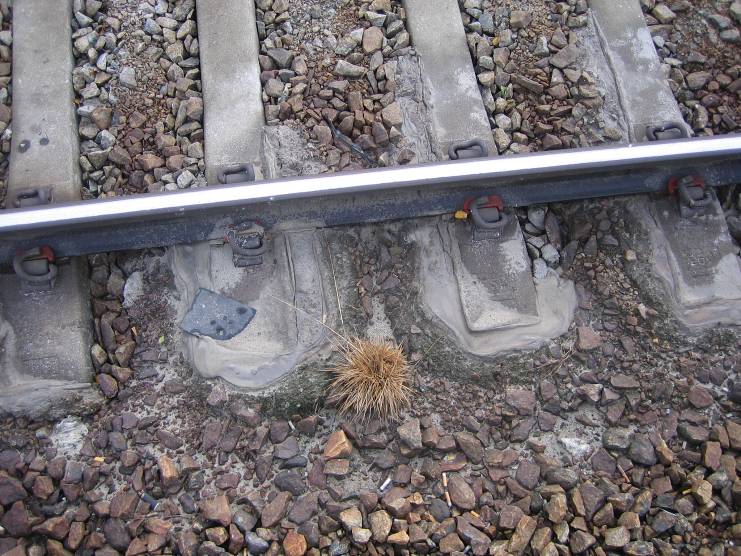
(b) Displaced pad and moving sleeper
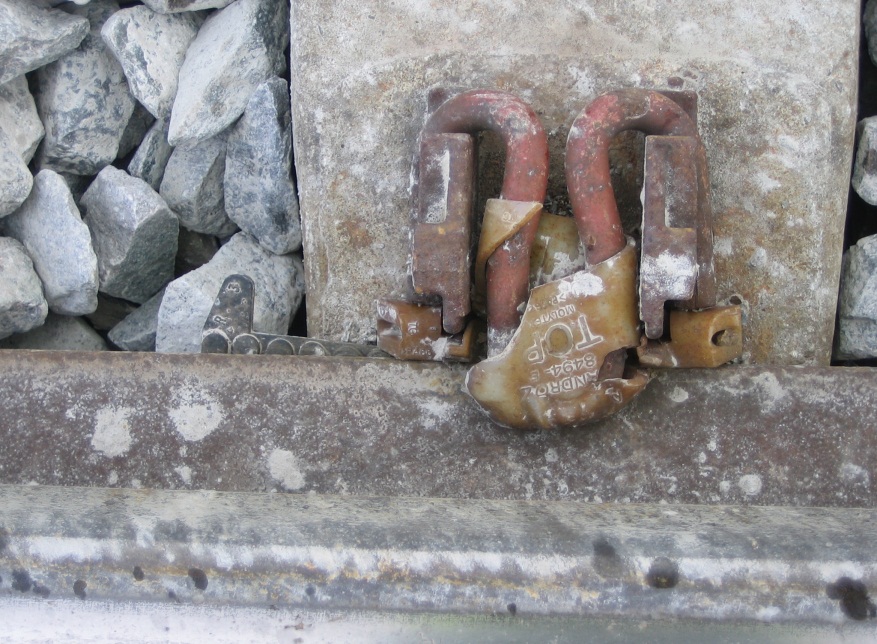
(c) Displaced pad and missing insulator
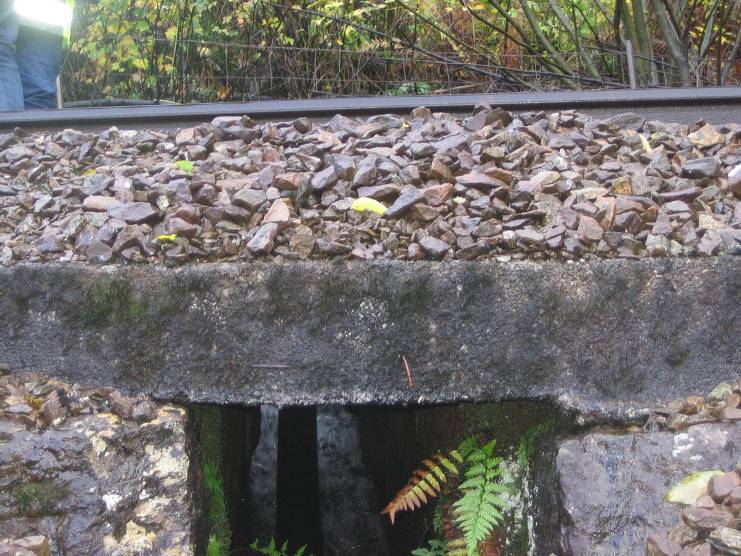
(d) Ballast loss at a culvert
The rail-surface defect in Figure 17.32(a) needs defect classification before grinding or replacement is selected; a photograph alone cannot determine crack depth. The culvert transition in 17.32(b) can create uneven stiffness and repeated sleeper movement. Figure 17.32(c) shows a broken sleeper and 17.32(d) a damaged drainage pipe. Replacing a sleeper without restoring its support, or treating geometry without correcting water flow, can leave the mechanism that caused the defect in place.
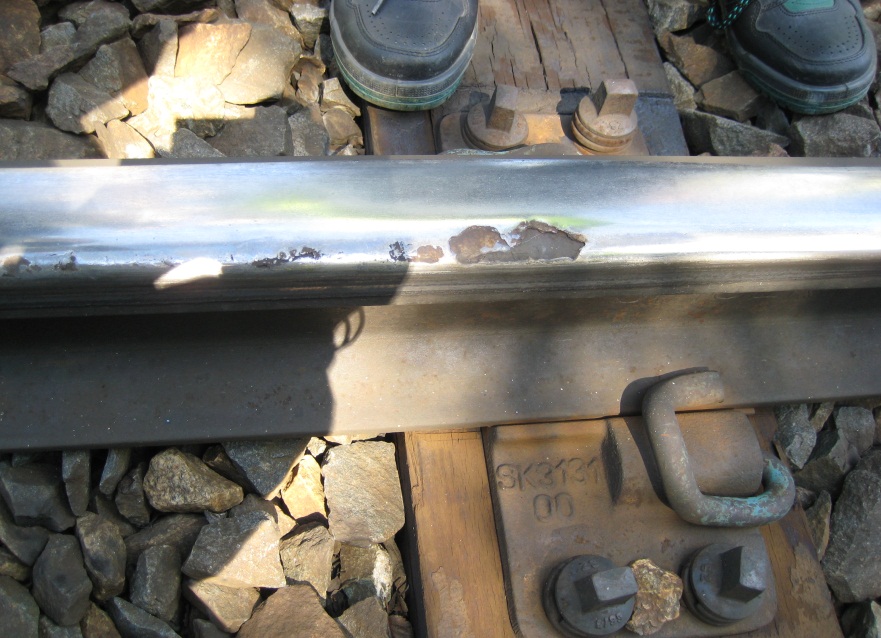
(a) Rail-surface defect
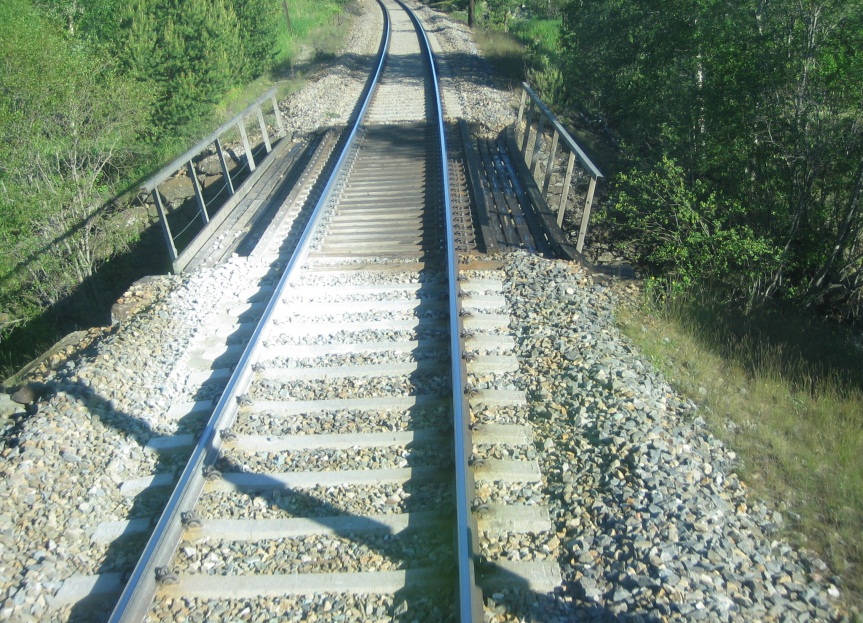
(b) Support transition at a culvert
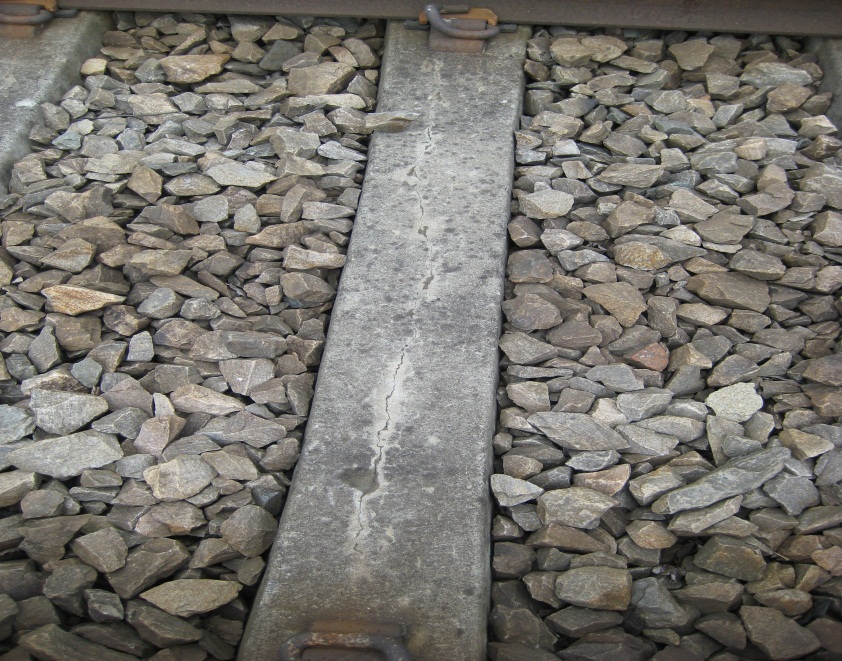
(c) Broken sleeper
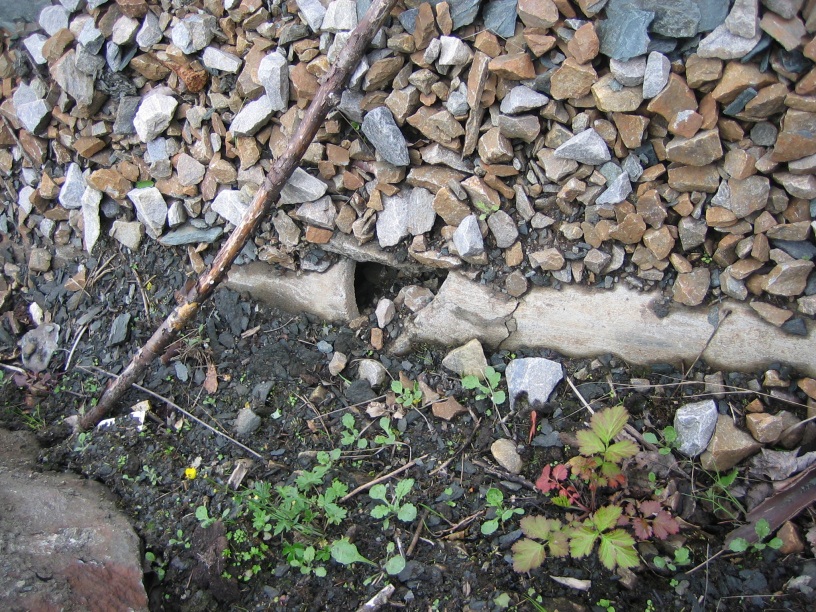
(d) Broken drainage pipe
17.4.6 Operational Challenges
The culvert and ditch in Figure 17.33(a) and 17.33(b) show how vegetation, deposited material and inadequate flow paths can impair drainage. Water retained in the track structure promotes settlement, fouling and frost problems. The ice in 17.33(c) and 17.33(d) can restrict clearance, obstruct equipment or change the local support condition. The response must address the water source and safe access as well as removing the immediate obstruction. Inspection before heavy rainfall, freezing or thaw can prevent a small drainage problem from becoming a service interruption.
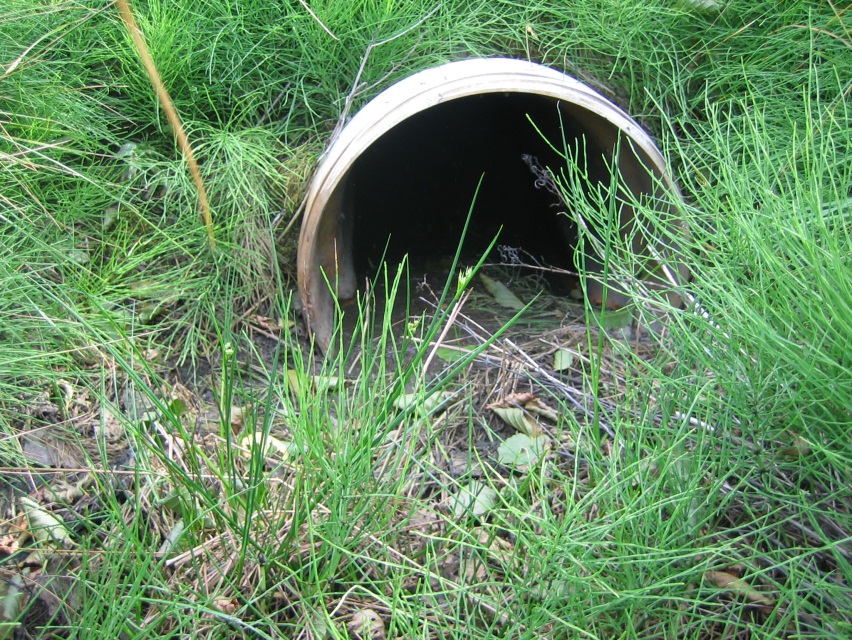
(a) Blocked culvert
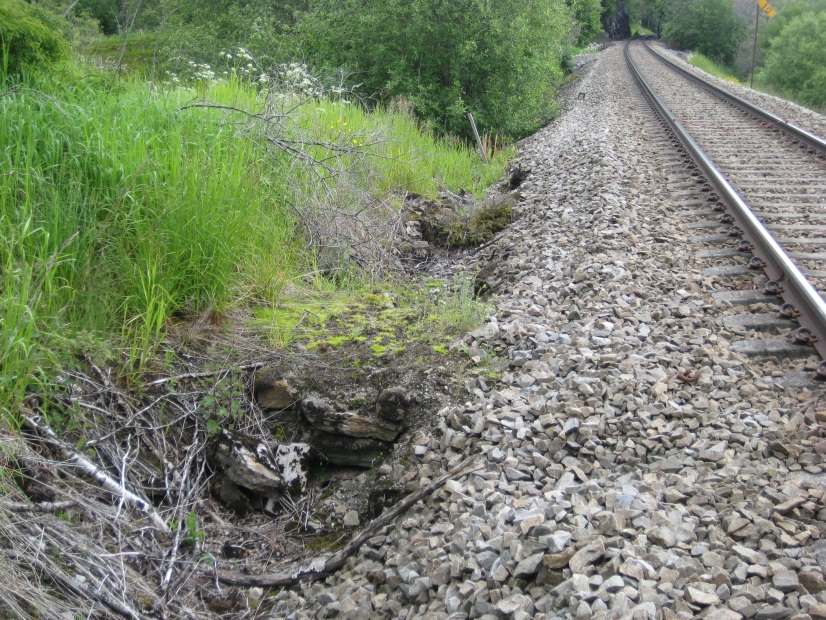
(b) Obstructed ditch
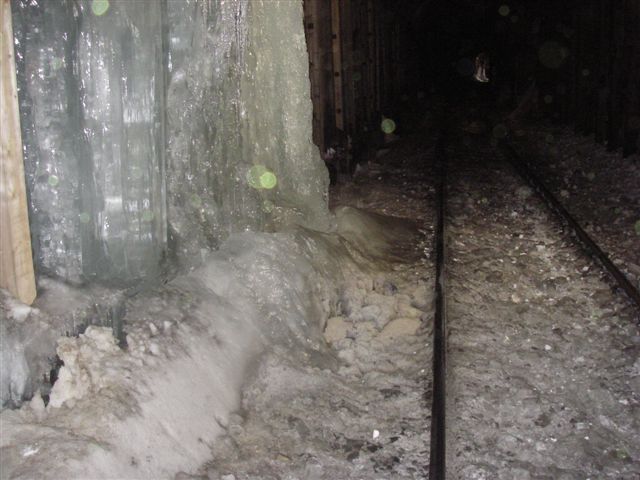
(c) Ice beside the track
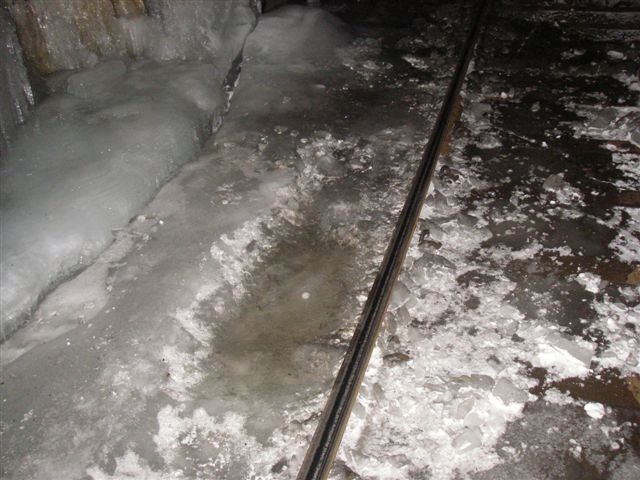
(d) Ice around the rail
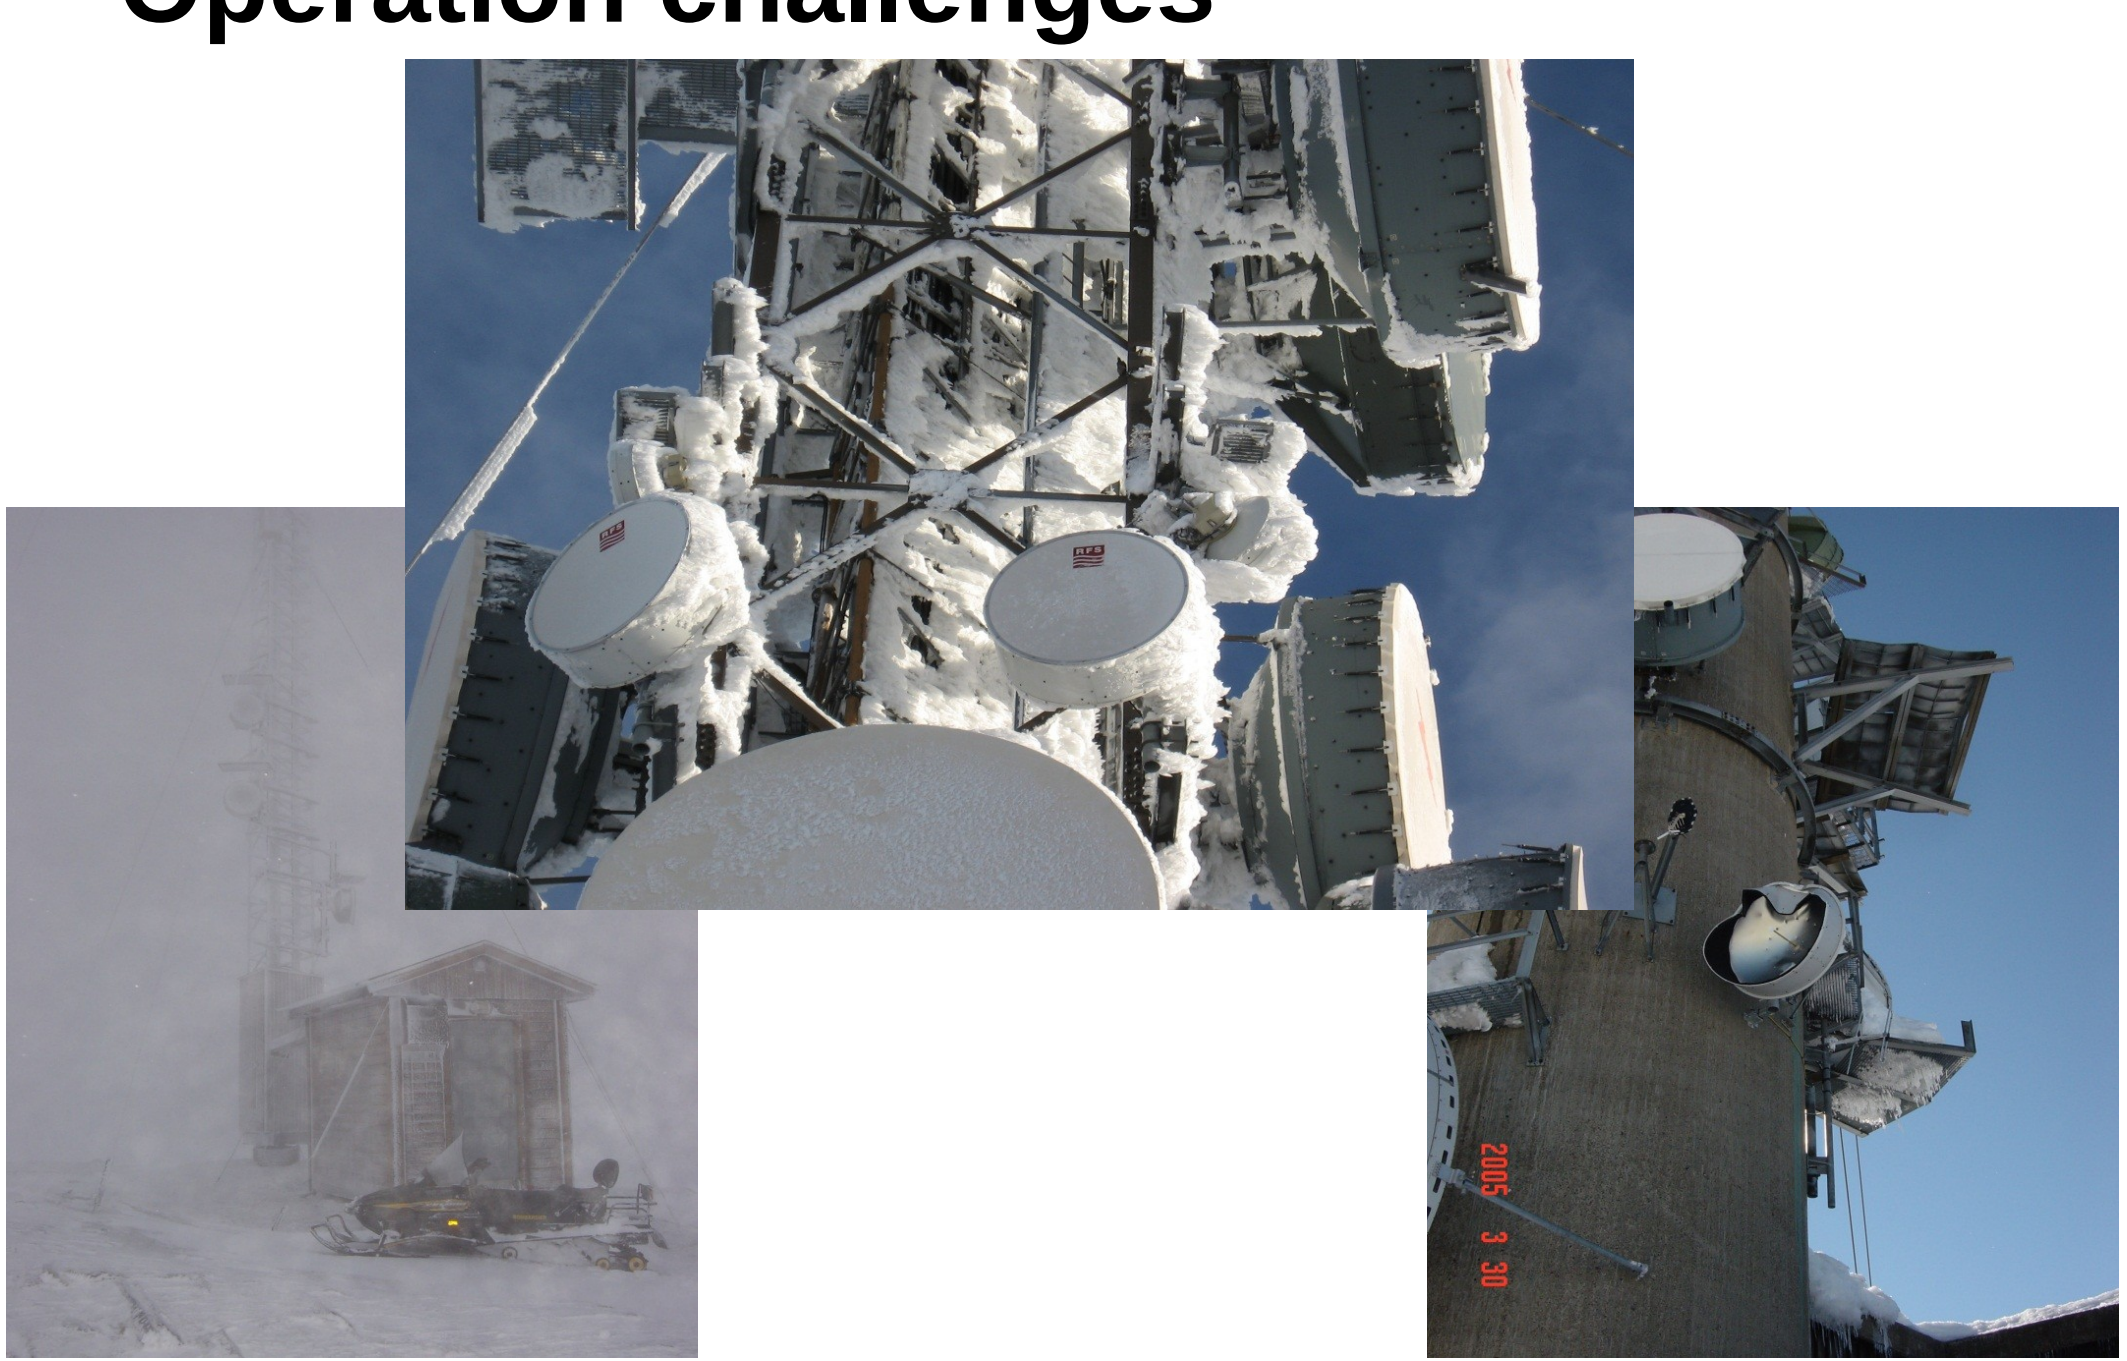
Figure 17.34 broadens the winter-maintenance view beyond the rails. The snow-covered site on the left illustrates access and visibility constraints; the iced structures and communications equipment show why railway maintenance must coordinate track, power and telecommunications work. These are historical photographs of exposure mechanisms, not a report of current faults at the pictured sites.
17.5 CWR Stress Management and De-stressing
Continuously welded rail (CWR) is detailed in Chapter 11; from a maintenance perspective, the key challenge is ensuring that the neutral temperature \(T_n\) (the temperature at which the rail has zero longitudinal stress) remains close to the prescribed laying temperature throughout the rail's service life. Bane NOR technical regulations specify \(T_n=(21\pm3)\,^\circ\mathrm{C}\) for Norwegian main lines [11].
17.5.1 Causes of Neutral Temperature Shift
The neutral temperature of a CWR section can shift away from the original laying temperature as a result of:
Tamping: Each tamping pass disturbs the ballast and sleeper support and may laterally reposition the sleepers. If the rail is in a longitudinal stress state at the time of tamping, the ballast consolidation process re-anchors the track at a slightly different position, effectively shifting the neutral temperature. Repeated tamping without re-stressing can cause the neutral temperature to drift upward (increasing the risk of rail pull-apart in winter) or downward (increasing the risk of buckling in summer).
Rail renewal and welding: Each thermite or flash-butt weld introduces a heat-affected zone. After cooling, the local stress state in the weld region may differ from the surrounding rail if the stress management procedure is not followed correctly.
Creep: Under heavy traffic, rails experience cumulative longitudinal displacement (creep) due to the asymmetric friction forces from acceleration and braking. Rail creep shifts the neutral temperature along the affected section.
17.5.2 De-stressing Procedure
Rail de-stressing restores the neutral temperature to the design value. The following conceptual sequence explains the mechanics. Actual work must follow the approved Bane NOR procedure, including temperature, length, friction release, fastening and welding controls [11, 68]:
-
Cut the rail: CWR is cut at a point that allows free movement. All fastenings on the section to be de-stressed (typically 400–600 m) are loosened to eliminate rail–sleeper friction.
-
Adjust rail temperature: Either (a) wait until the rail temperature equals \(T_n\), or (b) use a rail stretcher to mechanically elongate the rail by the amount \(\Delta L=\alpha L(T_n-T_{\mathrm{current}})\), where \(\alpha=11.5\times10^{-6}\,\mathrm{K^{-1}}\) is the coefficient of thermal expansion, and \(L\) is the section length.
-
Re-fasten: With the rail at the correct length (and thus zero stress at \(T_n\)), all fastenings are secured in the sequence required by the approved de-stressing method.
-
Weld: The cut point is closed by a thermite or flash-butt weld.
Mechanical stretching allows de-stressing below the target neutral temperature, within the limits of the approved procedure and available equipment. This is important in Norway because the neutral-temperature range for final welding is narrow \(18\text{--}24\,^\circ\mathrm{C}\). Taking tensile force and elongation as positive, the required stretching force is:
where \(E=210\,\mathrm{GPa}\) is the elastic modulus of rail steel, \(A\) is the rail cross-sectional area (60E1: \(A=76.70\,\mathrm{cm^2}\)), and the required elongation is \(\Delta L=\alpha L(T_n-T_{\mathrm{current}})\). This tensile-stretcher expression applies when \(T_{\mathrm{current}}<T_n\). At or above the target temperature, it gives zero or negative force; a tensile stretcher cannot impose that state, so the work must wait for a suitable temperature or follow another approved length-adjustment procedure.
17.5.3 CWR Inspection After Tamping
After tamping or other work on a CWR section, the maintenance team checks both geometry and the stress-management conditions before the line is handed back. Typical checks include [6, 50]:
-
Verify that no rail creep (relative movement of rail against sleepers) has occurred. Creep marks painted on the rail and sleeper before tamping are checked afterward.
-
Review whether the work has changed the stress-free rail length or moved the track laterally enough to require neutralisation.
-
Lateral ballast resistance is verified at the shoulder profile, measured after tamping and before a dynamic track stabiliser (DTS) pass where one is used.
17.6 Rail Lubrication
Rail lubrication reduces friction at the wheel–rail interface in specific locations where high friction causes excessive wear, noise, or guiding forces [68].
17.6.1 Gauge Face Lubrication
Gauge-face lubrication applies a thin film of grease or oil-based lubricant to the gauge face of the high rail in curves. This reduces the coefficient of friction at the flange–gauge-face contact from its dry value (\(\mu \approx 0.45\)–\(0.55\)) to a lubricated value (\(\mu \approx 0.10\)–\(0.25\)). The benefits are:
-
Reduced lateral (guiding) force \(Y\) on the high rail, reducing the risk of gauge face wear and of exceeding the Prud'homme limit.
-
Reduced wear rate on the gauge corner of the high rail and the wheel flange. On heavily curved lines, gauge-face lubrication extends rail life by a factor of 2–4.
-
Reduced rolling resistance on sharp curves, reducing traction energy consumption.
Lubrication is applied by trackside lubricators, automatic grease dispensers triggered by passing trains, or by on-board flange lubricators on the rolling stock. The lubricant is picked up from the rail gauge face by the wheel flange and transported along the rail for a distance of 0.5–2 km downstream.
17.6.2 Top of Rail Friction Management
The friction coefficient on the top of the rail (wheel tread–rail crown contact) affects traction, braking performance, and the risk of rolling contact fatigue (RCF). The optimal range is \(\mu_\text{optimal} \approx 0.30\)–\(0.35\):
-
Too high (\(> 0.45\), dry, contaminated): Excessive tangential stresses accelerate RCF and corrugation formation.
-
Too low (\(< 0.1\), wet leaf contamination or rail-borne lubrication): Loss of traction and braking adhesion, a major autumn safety hazard in Norway.
Top-of-rail (ToR) friction modifiers are liquid or solid compounds applied to the rail crown that reduce and stabilise friction in the optimal range, simultaneously reducing RCF initiation and corrugation. They are distinct from gauge-face lubricants: a gauge-face lubricant should not contaminate the rail crown.
17.6.3 Lubrication in Switches and Crossings
In S&C zones, lubrication of the tongue–stock rail contact (slide baseplate lubrication) reduces the operating force required by the point machine and prolongs tongue life. The slide baseplate lubricant must not migrate to the tongue tip area, as the switch rail must make firm contact with the stock rail at the toe to provide safe train routing.
17.7 Chapter Summary
Condition control. Track condition deteriorates under traffic, weather and time, so maintenance must keep the infrastructure within safe and functional limits. Corrective maintenance responds to defects, while preventive and condition-based maintenance aim to intervene before defects become operational restrictions. The maintenance strategy manages risk, cost and availability over the asset life.
Geometry measurement. Gauge, longitudinal level, alignment, cross-level and twist are measured and compared with maintenance, action and immediate limits. Track quality indices combine measurements into condition indicators that support planning. These thresholds determine whether work can be planned normally, must be done before the next inspection, or requires immediate action or speed restriction.
Tamping. Tamping lifts and lines the track and consolidates ballast under the sleeper, but it also disturbs the ballast structure and temporarily reduces lateral resistance. On CWR track this matters because reduced resistance can increase buckling risk. Post- tamping inspection, dynamic stabilisation, speed restrictions and temperature control are therefore part of safe geometry maintenance.
Contact management. Preventive grinding removes a thin damaged layer and restores profile before cracks grow, while corrective grinding removes deeper defects at higher cost. Gauge-face lubrication and top-of-rail friction management reduce wear, noise and rolling contact fatigue when applied correctly. These measures must be coordinated with curvature, traffic, braking and environmental conditions so that they improve contact behaviour without creating adhesion problems.
Planning balance. The best intervention is not always the one that corrects the most geometry in a single visit. The engineer must consider degradation rate, possession length, traffic disruption, neutral-temperature control, defect consequence and future renewal plans. A good maintenance strategy intervenes early enough to preserve safety and asset life, but avoids unnecessary work that consumes capacity and budget without reducing risk.
Assignments
Assignment 1: Maintenance strategy and inspection logic
For a railway track section, explain how corrective maintenance, preventive maintenance, condition-based maintenance and renewal differ from each other. Relate your explanation to the early-failure, random-failure and wear-out parts of the bathtub curve. Then explain how walking inspection, rail-flaw testing and diagnostic geometry measurement contribute different information to the maintenance work list.
Assignment 2: Track geometry parameters
For each of the following track-geometry parameters, define what is measured, identify how it is represented in the figures in Section 17.2, and state one typical maintenance action that may follow if the parameter exceeds its limit: track gauge, longitudinal level, horizontal alignment, cross-level/cant and track twist. For track gauge, also state the gauge-point depth \(l_p\) used below the rail-head top.
Assignment 3: TQI and K-number calculation
A 1000 m Q2 line section is divided into five 200 m assessment windows. The illustrative data give standard deviations for vertical geometry \(\sigma_H\), cant \(\sigma_R\), horizontal geometry \(\sigma_P\), and interaction \(\sigma_S\). Use the Q2 limits in Table 17.13 and the formula
to form a separate comparison indicator. Use the supplied \(\sigma_S\) values for the K-number assessment.
All \(\sigma\)-values in the assignment table are in millimetres.
| Window | \(\boldsymbol{\sigma_H}\) | \(\boldsymbol{\sigma_R}\) | \(\boldsymbol{\sigma_P}\) | \(\boldsymbol{\sigma_S}\) |
|---|---|---|---|---|
| 0–200 m | 1.10 | 0.85 | 0.55 | 1.01 |
| 200–400 m | 1.38 | 1.18 | 0.73 | 1.39 |
| 400–600 m | 1.60 | 1.30 | 0.85 | 1.55 |
| 600–800 m | 1.42 | 1.00 | 0.60 | 1.17 |
| 800–1000 m | 1.20 | 0.90 | 0.70 | 1.14 |
(a) Calculate \(\sigma_{RP}^{*}\) for each window and explain why it cannot generally replace the measured \(\sigma_S\). (b) Calculate the normalised comparison index \(\mathrm{TQI}_{\mathrm{norm}}\) for the 400–600 m window using the TQI expression given in Section 17.3.4. (c) Decide which 200 m windows count as OK for the K-number calculation. (d) Calculate \(K\) and interpret the result for a Q2 line using Table 17.14.
Assignment 4: Selecting a maintenance intervention
A mixed-traffic track section at 160 km/h shows the following inspection results: vertical level and horizontal alignment deteriorate again within one year after tamping, drainage ditches are partly blocked, a ballast sample contains about 28% fine material, rail corrugation is visible in a curve, and the section is continuously welded rail that has recently been tamped in warm weather. Propose a maintenance plan. Explain which findings point toward tamping, drainage repair, ballast cleaning or renewal, rail grinding and CWR stress-management checks. Also state which parts should be treated as maintenance decisions in this chapter and which machinery details were introduced in Chapter 5.
Assignment 5: Track geometry limit assessment
A Q2 line section (\(120 < V \leq 160\) km/h) has been measured by a track-recording vehicle. Assume \(R \geq 400\) m for the twist checks and a mixed-traffic curve for the absolute cant check. Use the geometry-limit tables in Section 17.2 to assess the measured values below.
| Geometry quantity | Measurement basis | Measured value |
|---|---|---|
| Track gauge | deviation from 1435 mm | +18 mm |
| Gauge variation | change over 10 m | 8 mm |
| Longitudinal level | D1, each rail, 3–25 m | 11 mm |
| Horizontal alignment | D1 versine/side error, 3–25 m | 15 mm |
| Cross-level irregularity | deviation from 20 m mean cant | 7 mm |
| Absolute cant | mixed-traffic curve | 155 mm |
| Track twist | 2 m base | 9 mm |
| Track twist | 9 m base | 32 mm |
(a) For each row, decide whether the measured value is within the maintenance limit, exceeds the maintenance limit, exceeds the action limit, or exceeds the immediate limit. (b) Identify the most urgent defect and explain what maintenance response should be planned.